Tutorial
Domain's competitors
Competitors report shows the distribution of positions, traffic, and the number of keywords for which a domain ranks in the top 100 Google. Suitable for analyzing both organic and paid search results.
The graph changes depending on the selected competitors (select with check-boxes in the table or to the right of the graph — 1), and also depending on the indicator for analysis (2) — the screenshot below shows three options:
- traffic share (%),
- keywords quantity,
- average position.
The table below the graph lists the top 100 competitors. Add to the graph up to 10 domains you are interested in by checking the boxes.
To analyze more domains, go to the API. We will be expanding the number of domains in the table shortly.
Let's see what the analysis is for by three indicators: traffic share, keywords quantity, and average position.
"Traffic share" — the share of domain traffic in the total traffic of all found competitors (i.e. domains that were in the top 20 of the search engine for at least 2 keywords in the project).
It will show you part of your site's traffic, which competitor is in the lead, and what domain will help optimize your site: analyzing the keywords of a competitor and adding missing keywords, backlink profile, PPC.
This slice of the market shows an improvement in the site's rankings for specific phrases and growth in traffic.
To analyze market, divide the site into conditional segments and goods/products. Assign each group the appropriate mark and use the tag filter to analyze each group separately:
This grouping will show you the complete statistics. Each group of keywords will have its competitors and its visibility in the search. You will see your place in every such niche in the market.
"Keywords quantity" — the number of keywords for which a domain ranks in search results.
The graph shows the quantity of the keywords changing in the analyzed domains — this will help you understand how actively competitors work with keywords and optimize the work on their side. After all, the more keywords a competitor has, the more chances he has to take the first positions, overtake you in traffic.
"Average position" — the average position of a domain for all keywords of a project. The domain's most frequent position in the search results is displayed as the best position.
Suitable for analyzing domain positions. Add competitors to the graph and see who is ahead of you in the average position. Analyze your competitor in the Domain analysis: Keywords report. Upload the keywords using a filter by Frequency and add them to your site. This strategy will increase your chances of positioning higher.
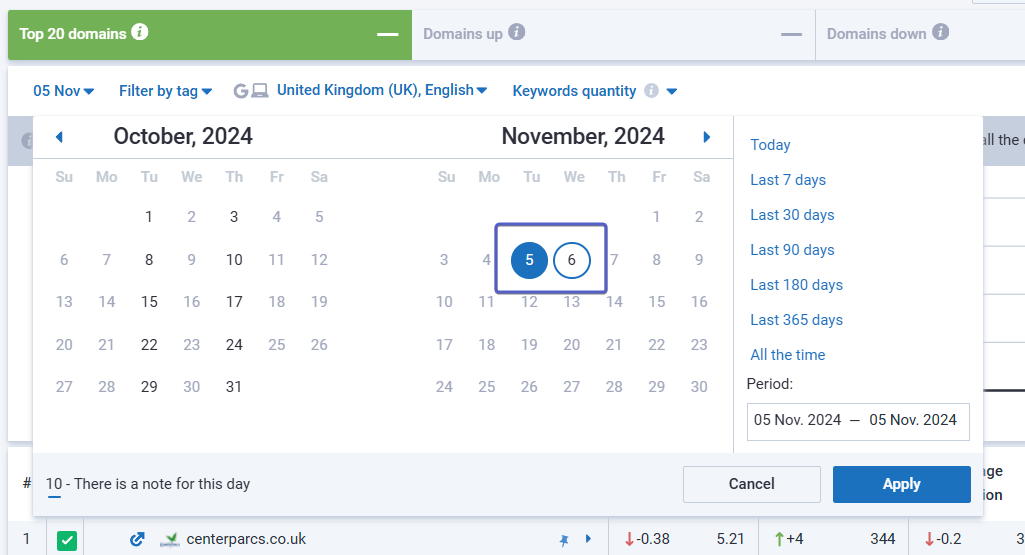
View graphs in the Competitors report within the desired period. It allows to see the distribution of indicators of competing domains in the top 100 search results and assesses the dynamics of their changes.

At the top of the report, there are quick filters to switch between report modes quickly.
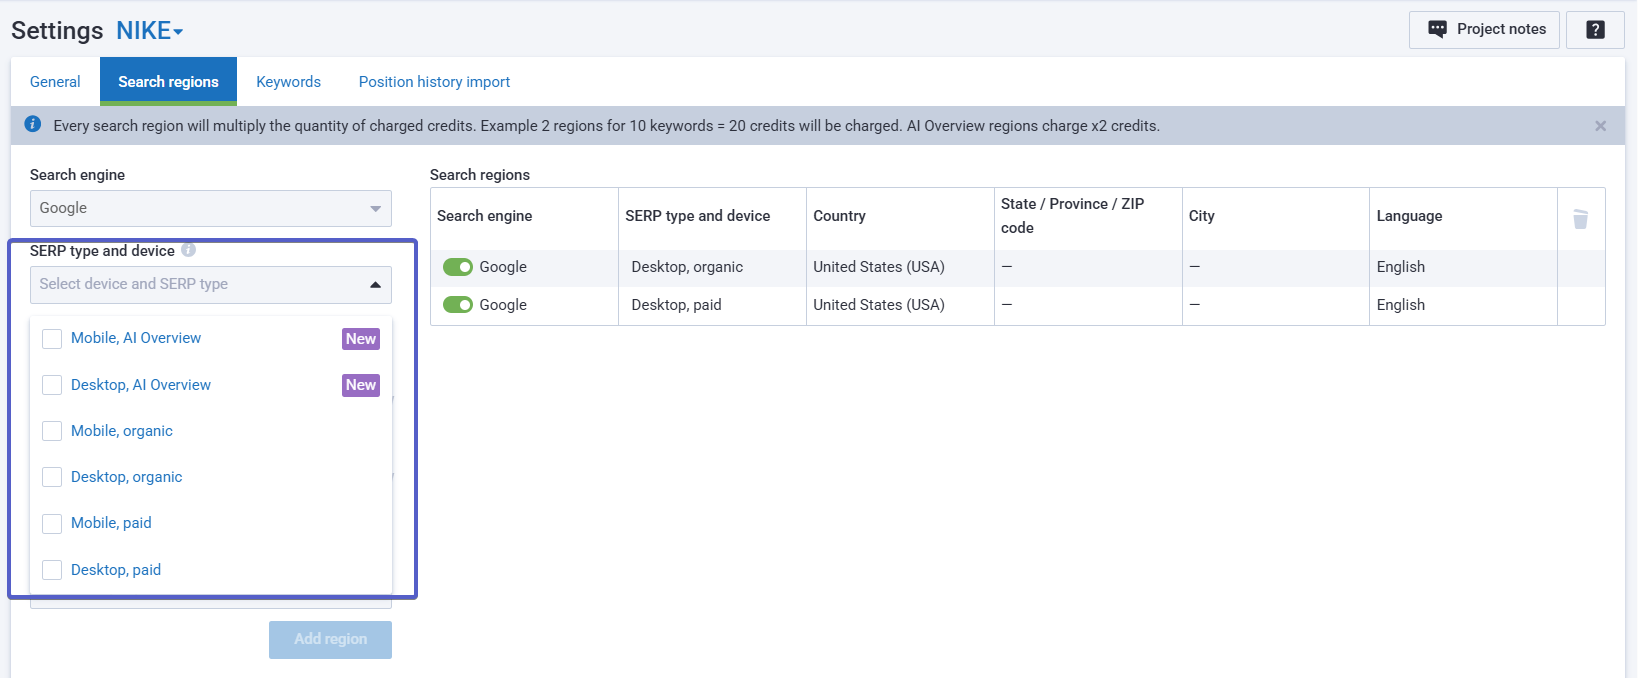
To analyze metrics for paid SERPs, change the switch to "Paid" in the Competitors report.

You can customize the table by adjusting the column sizes for your convenience!
Still have questions? Find answers in our FAQ, use cases or contact the tech support chat.


