Tutorial
Backlink dashboard
The "Backlink dashboard" page provides an overall assessment of the volume and quality of a domain's backlinks.
For more information about this report, watch our video.
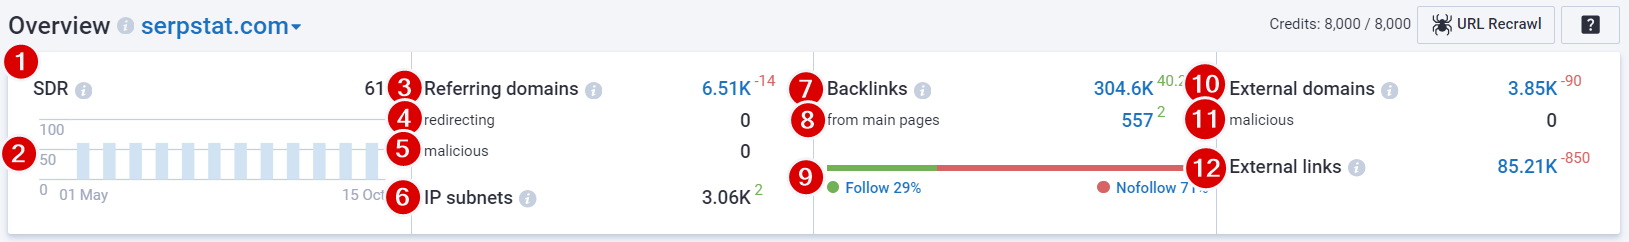
At the beginning of the summary report are the following indicators:
- Serpstat Domain Rank (SDR). This is an indicator of domain authority on a scale from 0 to 100. It depends on the number of referring domains, as well as on the number of domains linking to these referring domains. Thus, all sites in the Serpstat index associated with the analyzed domain are taken into account.
- SDR history. This is a history of SDR for the last six months. Open the chart to see more details. The chart is updated every two weeks and highlights changes in red and green.
- Referring domains. This is the total number of domains linking to the analyzed domain.
- Redirecting domains. This is the number of domains that completely redirect to the analyzed one, while passing the link juice.
- Malicious domains. This is the number of links from malicious sites. The verification algorithm is used, similar to the algorithms in Google Chrome. Malicious domains are those that Google Chrome does not recommend to visit and blocks the transition if you try with a notification.
- IP subnets. This is the number of referring class C subnets.
- Backlinks. This is the number of links to the domain or URL. An accelerated calculation algorithm was used, so the result may differ slightly from the exact value in the detailed report.
- Referring main pages. This is the number of links from the home page of referring domains.
- Follow / Nofollow links. This is the number of backlinks with the follow (or no parameter) / no-follow parameter. Displayed as a percentage of all backlinks to the searched ones.
The link is marked as no-follow if such a parameter was found in the link during the analysis. In all other cases, the link is marked as "follow". - External domains. This is the domains to which links lead from the analyzed site.
- Malicious external domains. This is the number of external links to malicious sites.
- External links. This is the external links from the analyzed site.

- Serpstat Recrawling URL Tool — tool for updating or adding information about page links by Serpstat bots. If you want to recrawl the URLs, just press the button in the upper right corner to start scanning and specify the pages of sites to crawl. The link data will be verified within 1 day.
The number of pages to check is 500 URLs per day. The remaining credits are not summed up, but expire. - Tutorial — the button will direct you to the tutorial for the report.
Below are the charts:
- Linking domain dynamics. The graph shows the dynamics of adding referring domains to the analyzed domain/URL over the past half year in increments of one week.
- Linking page dynamics. The graph shows the change dynamics in the number of pages referring to the analyzed domain/URL. The data on the graph is displayed for the last half year in increments of one week.
When you hover over the chart, a tooltip appears with the date, the number of referring pages, and the trend value for the selected point. - New and lost backlinks. The diagram shows the number of new and lost external links from the analyzed domain or URL by the dates when the breakthrough occurred over the past half year.
The green bars in the chart represent new links. They have positive values on the vertical axis.
The red bars are below the green bars in the diagram and correspond to lost links. They have negative values on the vertical axis.
When you hover over the chart, the selected column is highlighted and a tooltip appears with the selected date, as well as the number of new and lost links. - SDR distribution. The graph shows the donor distribution of the analyzed site by SDR (Serpstat Domain Rank).
- You can select the desired period for the charts.
Below is a detailed table on the link distribution:
- Backlinks distribution. The backlinks ratio of different types.
- TOP anchor backlinks by popularity. The most popular anchors in backlinks and the number of links with the specified anchor.

The domain map shows the distribution of referring domains by top-level domain zones and by country.
When you hover over a country highlighted in blue, a tooltip appears with the number of referring domains from this country as a percentage of domains to all domains linking to the analyzed site.
The higher the percentage of referring domains, the brighter the highlight of the corresponding country on the map. A legend is displayed below the map, which shows what percentage of referring domains corresponds to highlighting.
The referring domains distribution table displays referring domains by country and by top-level domain zones.
There is a search by matching part of the word: when entering text, the table filters the results containing the entered text.