Tutorial
Project overview
In the report "Project overview" you can see the basic information about the positions of the project for keywords added to the project.
1. Project name. By clicking on it, you will have the opportunity to go to the report of another project.
2. Credits counter — displays the balance of credits on the user's account.
Report appearance settings — disables unnecessary columns or graphics, changes the display order of columns.
Filter — the report can be filtered by:
- keyword
- better position
- volume
- SERP features
- date added
Quick filters for these parameters are also available:
Project settings — go to the project settings on the "General" tab.
Project notes — notes can be left for any date.
Export report — reports can be exported in the format:
- csv
- xls
- xlsx
- Google Sheet
3. Send feedback — opens the support chat for sending suggestions for improving or reporting an issue.
The detailed guide about report using — the button will direct you to the tutorial for the report.
4. The table and graphs contain detailed information about changes within the site:
Visibility — the percentage of the total visibility that the selected domain gets for the project keywords.
Average position — the average position among all the best positions in the search results of the selected domain.
SERP storm — the percentage of changes in the SERP by project keywords.
SERP features — the number of SERP features for the project keywords, in which the selected domain was noticed.
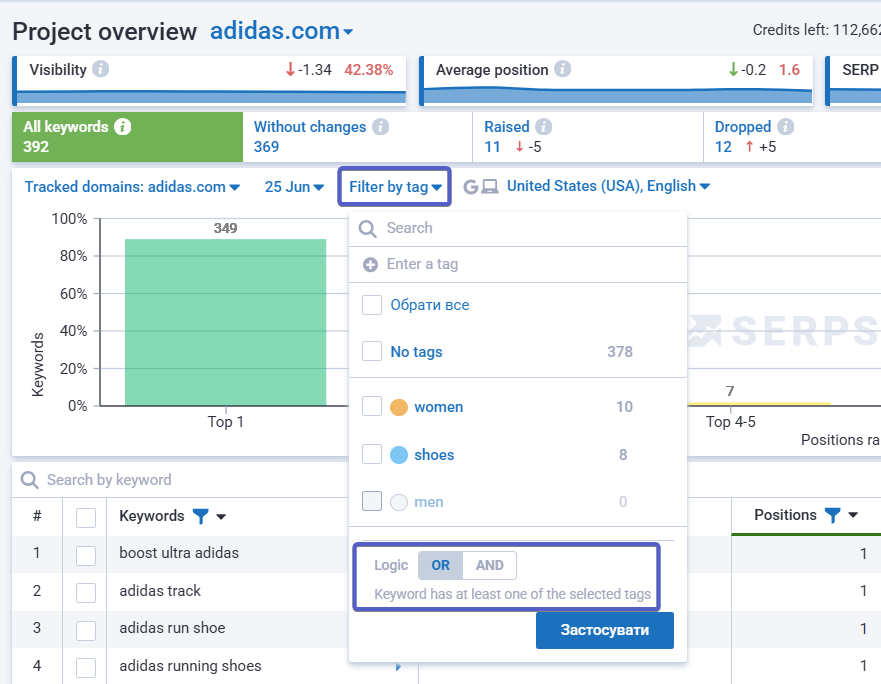
5. Information in quick filters:
All keywords are the default filter used to load the report. All keywords added to the project are loaded by the filter including keywords for which no data is available.
Without changes — keywords for which there was the position, and it has not changed or for the keyword, the domain was out of the top and remained out of the top.
Raised — all the keywords for which the positions have grown (from 50 to 20), or the domain was out of the top and got to the top (from "-", now 80).
Dropped — all the keywords for which the positions have dropped (from 20, now 50) or the domain was in the top, and then dropped out (from 80, now "-").
New — all keywords for which positions appeared (it was "-", now it is 80).
Lost — all the keywords for which there were positions, but now the domain is out of the top (it was 80, now "-").
Out of top — all keywords for which the domain is out of the top by the last update of positions.
The position distribution graph by ranges takes into account all positions in the search results of the selected domain for a keyword. It is built based on the selected domain, the selected period and tags are taken into account. When you hover over a point, the number of positions, their percentage of the total number in the project, and the dynamics as a percentage of the previous removal of positions are displayed.
The color scheme was made as close as possible so that there was the same highlighting logic on the chart and in the table when switching to the history of keywords.
1) Selecting a domain allows you to choose what you want to see positions relative to (an analyzed domain or select your competitor).
2) Datepicker — allows you to select the date or period for which the data is required.
3) Filter by tag — allows you to sort keywords by category. The tag can be created locally in the dropdown or the "Settings", and also it is possible to assign a color (6 colors are available, one color can be used for several tags):
4) Filter by region — allows you to sort data of the project by several regions. You can display data both for one region and for several ones.
5) To the right of the graph, you can edit the display of the dynamics for the desired top for yourself.
6) Hide graph — the button allows you to hide the graph for displaying more data in the table below.
You can now switch between OR and AND modes when filtering, providing greater flexibility for keyword segmentation.
OR — a keyword is included in the results if it has at least one of the selected tags.
AND — a keyword is included in the results only if it has all selected tags at the same time.
In the keyword table, which can be customized by you, the report shows the site position in the search results for the tracked keywords, volume and dynamics.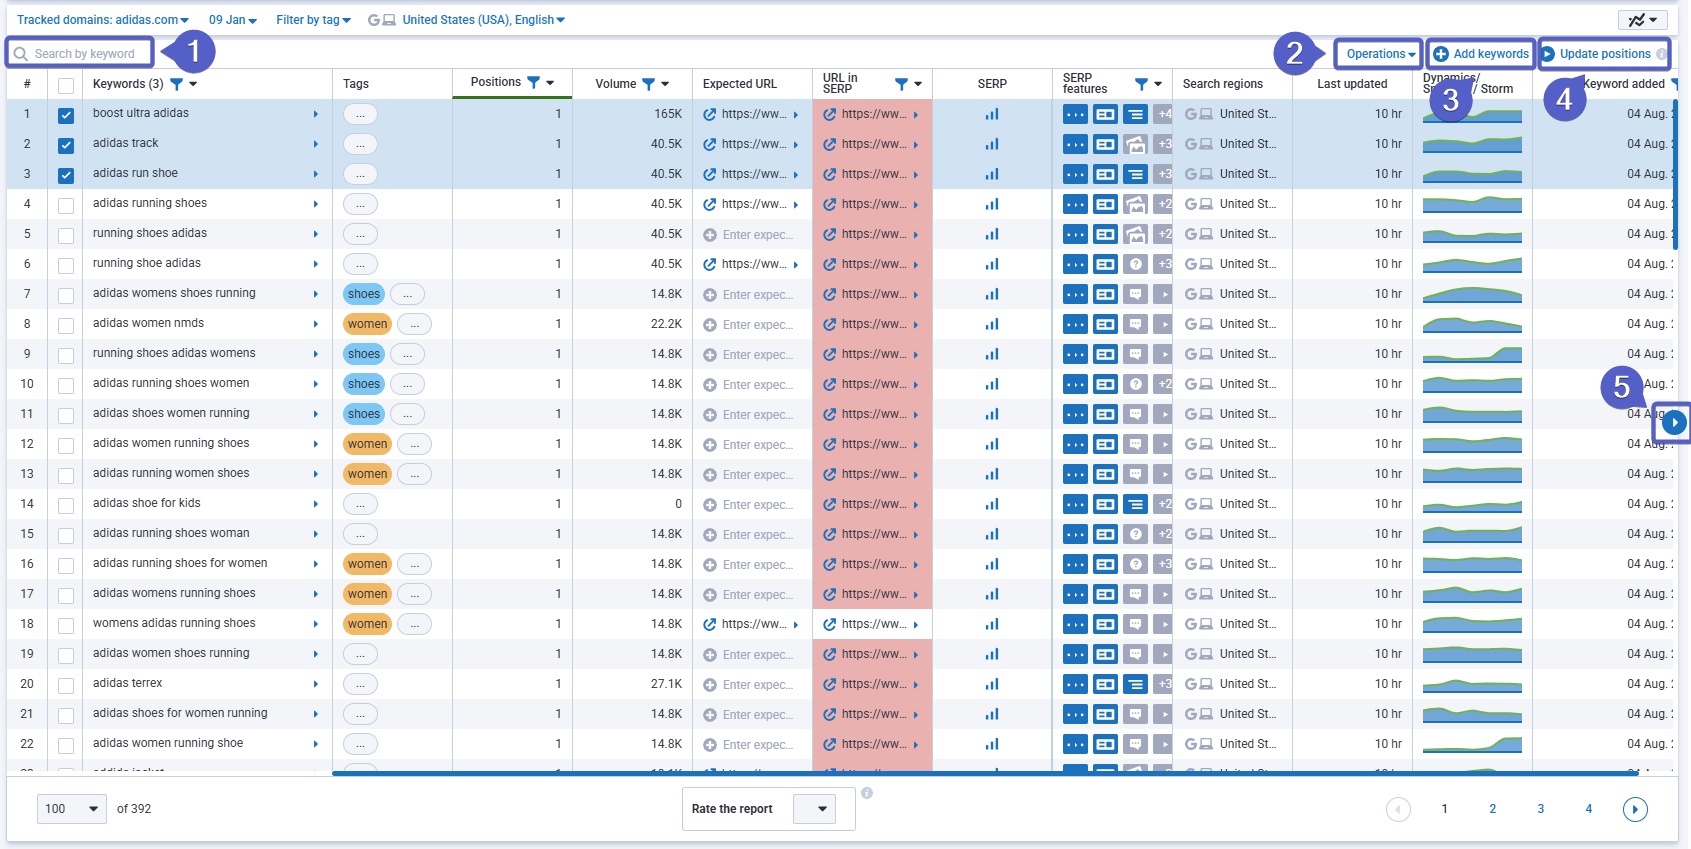
You can customize the table by adjusting the column sizes for your convenience!
1. Search by keyword
2. Operations — select the keywords with which you want to perform operations and click the "Operations" button, then select the action you need from the drop-down list:
3. The "Add keyword" button will open a tab with settings for adding new keywords.
4. To update positions in manual mode (regardless of the set automatic monitoring by schedule), you must:
- select the required regions (1);
- select the keywords with check-boxes (2);
- click the "Update positions" button(3);
- in the opened window, check the number of selected keywords to be sent and the number of credits that will be spent;
- click the "Start tracking" button (4):
5. A button that allows you to view the rest of the columns of the report.
Data in the table:
Keywords are keywords that are added to the project.
Tags — for each keyword you can assign tags (one or several) for the convenience of working with keywords.
Position — the position that the site ranks in the search results for the selected search engine.
Volume is indicated per month in the selected country or city.
Expected URL is the address you expect to see in search results for a specific keyword.
URL in SERP is the address that actually appears in search results for this keyword. If the URL is highlighted in red, it means that the expected target URL does not match the one shown in the search results (you can also filter data in this column).
SERP — the history of SERP for a keyword (the report will be opened in a new tab or you can go through the side menu).
SERP features — icons of SERP features that were found for the analyzed domain in Google organic results for a given keyword marked in blue, if another domain was noticed, they will be highlighted in gray color.
Search regions — shows the region that is selected in the filters.
Last updated — the time or day when the positions of keywords were last updated.
Dynamics/Snippets/Storm — visualized history of:
- domain position changes for a keyword in the selected regions;
- changes in snippets (Title, URL, description are displayed inside the snippet; color highlighting indicates that a change has occurred in the snippet itself, and not its position);
- changes in the top 100 positions for a keyword relative to the previous date (the storm value for a keyword can range from 0% to 100%).
Click "More details" to open detailed information:
Keyword added date — shows the date when the keyword was added to the project (by default new phrases are displayed first, older ones below).Please note, sorting is unavailable when several search regions are chosen.
How to read AI Overview results:
- “—” in the Positions column means the domain does not appear in the AI Overview block.
- “X” means AI Overview was not detected for this keyword in this region.
- A number indicates the domain’s position within the links block on the right side of the text snippet.
- +100 means the domain has appeared in the block compared to the previous check.
- –100 means the domain has disappeared from the block.
SERP Storm is not available for this tracking type because rankings in AI Overview change too dynamically.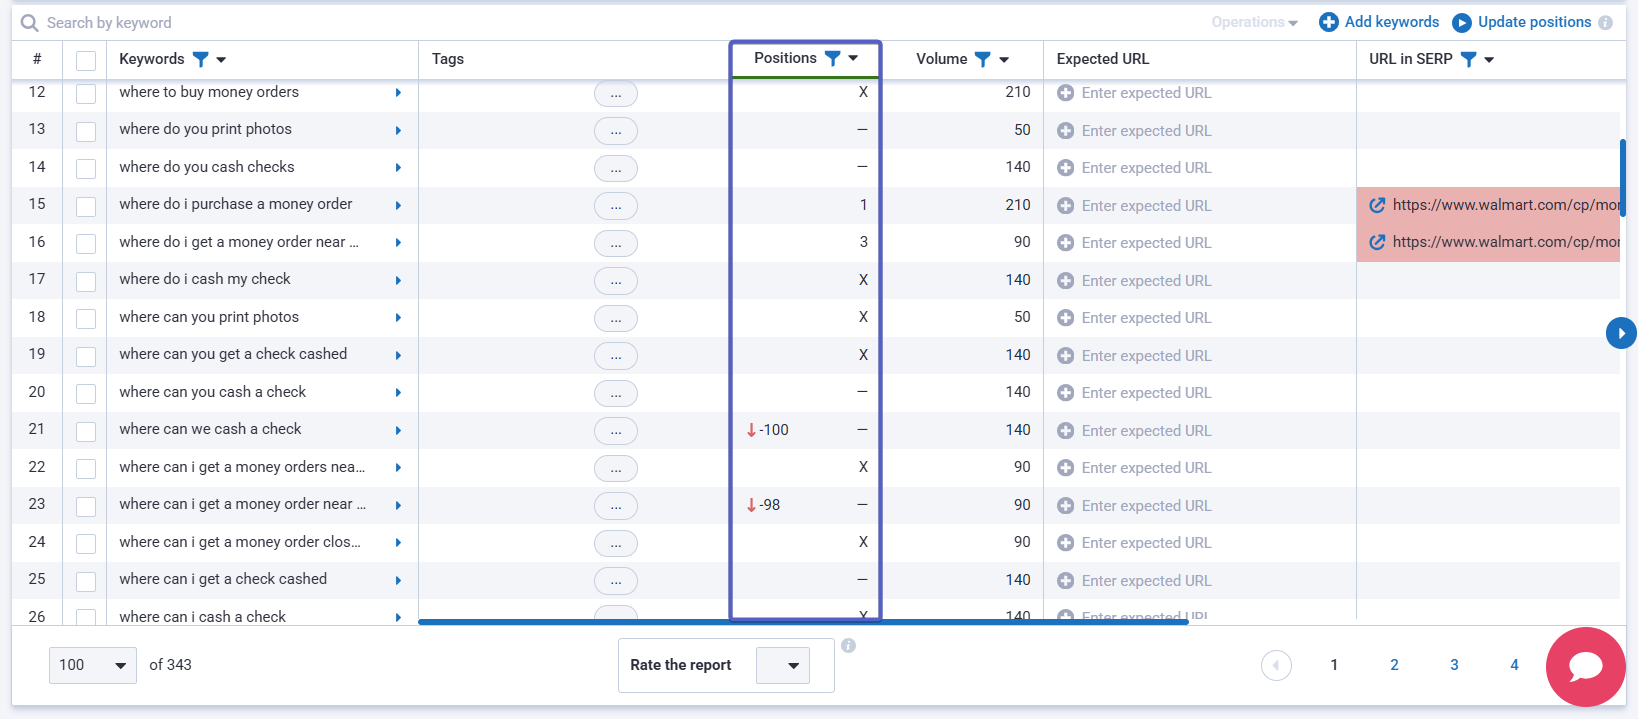
Still have questions? We recommend you our article on the blog. And also you can find answers in our FAQ, use cases or contact the tech support chat.
To learn more about how the tool works, you can watch the attached video!