Tutorial
My projects
This is the homepage page after you log in.
In this section, you have a list of all your projects. You can edit them, create new ones, combine them into groups, and view general information about the project.
If you haven't created your first project yet but want to explore common search analysis reports, scroll down and choose one of the common use cases.
Once you add at least one project, you are able to get AI-based insights about abrupt changes in visibility, traffic, and organic keywords count for your projects. Promptly analyze sudden spikes and drops to amend your SEO strategy.
Monitor such Events in the right menu by clicking your profile picture in the top-right corner.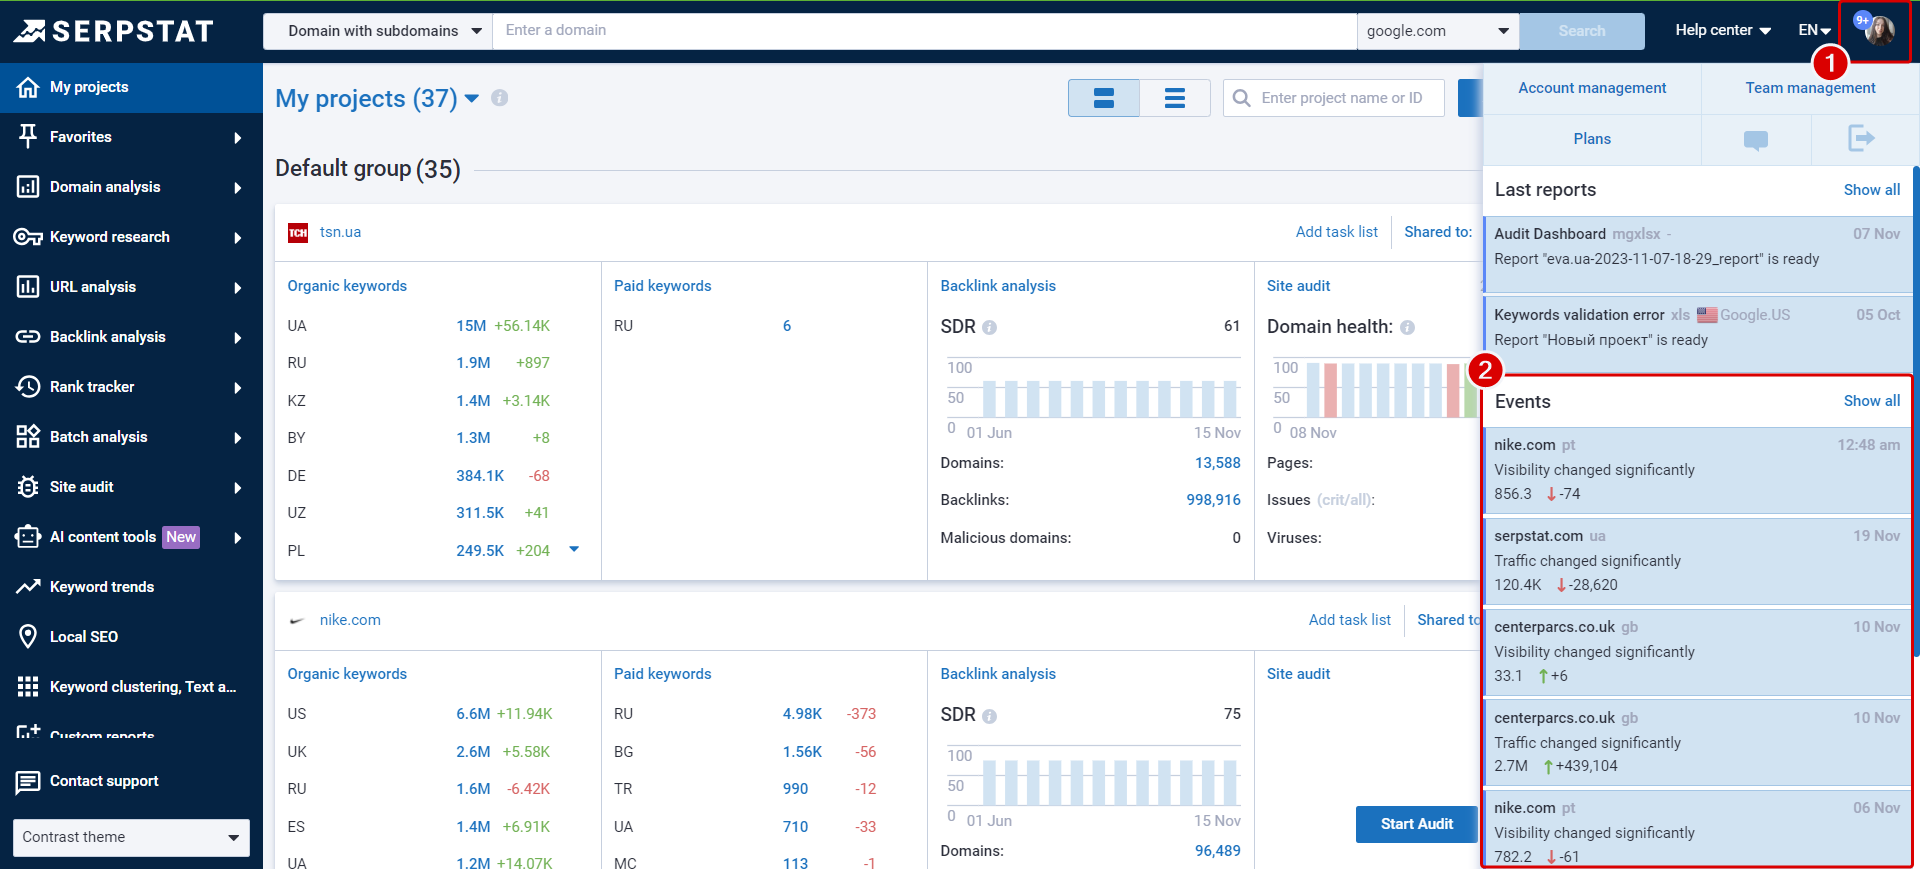
The notification indicates the date, the domain name, the metric that has abruptly changed, its previous value, and the current dynamic.
Notifications are kept for one month and removed afterward.
Click on the notification to read it. You are then forwarded to the dynamics graph in the domain Overview report.
5 notifications are displayed by default. To display all notifications, click "Show all"
Insights will further be available for more metrics. Let us know the metrics you would like to be notified about in support chat.
To get notified about AI insights, create a project.
Here are several ways to add a domain to your projects list, here are two of them:
While analyzing the site in the "Domain analysis" — "Overview" section, (1) click the "Track domain" button or (2) the star in the search bar. The domain will automatically appear in the "My projects" section.
Pin your most frequently used reports to "Favorites". This way, you'll be able to access the needed report within seconds without searching it across the sidebar. If no reports are pinned, "Favorites" are not displayed.
Besides the left sidebar, use the search bar to navigate to reports: enter your query and select where to go.
What you can do with the project control panel: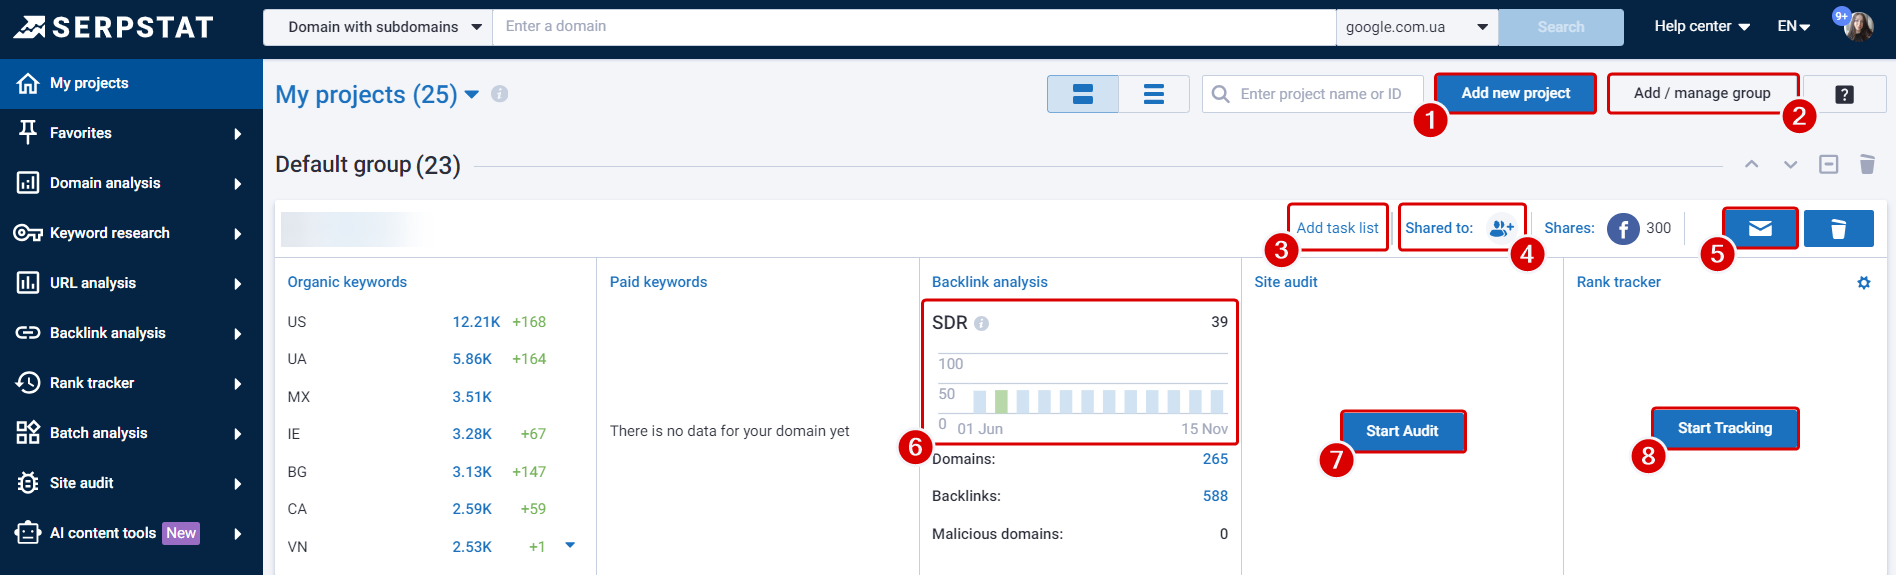
1) add new projects and also search for them using the name or project ID, via the search bar on the left;
2) manage groups of projects;
3) create checklists;
4) share access to the project;
5) set automatics email reports (see details below);
6) monitor SDR history for the last 6 months;
7) start site audit;
8) set up position tracking for keywords;
5.1) Configure the distribution of reports under the sections "Domain analysis" (Overview), "Backlink analysis", "Site audit" and "Rank tracker" (when you set up reporting for "Domain Analysis" and "Backlink Analysis", the first letter will be sent to the specified mail immediately, the rest — according to the schedule):
Determine whether automatic reports mailing is enabled or disabled by the button's color with the mailing icon.
If the button is green, the mailing is enabled; if it is blue, it is disabled.
To find out for which modules the mailing is enabled, click on the green mailing icon.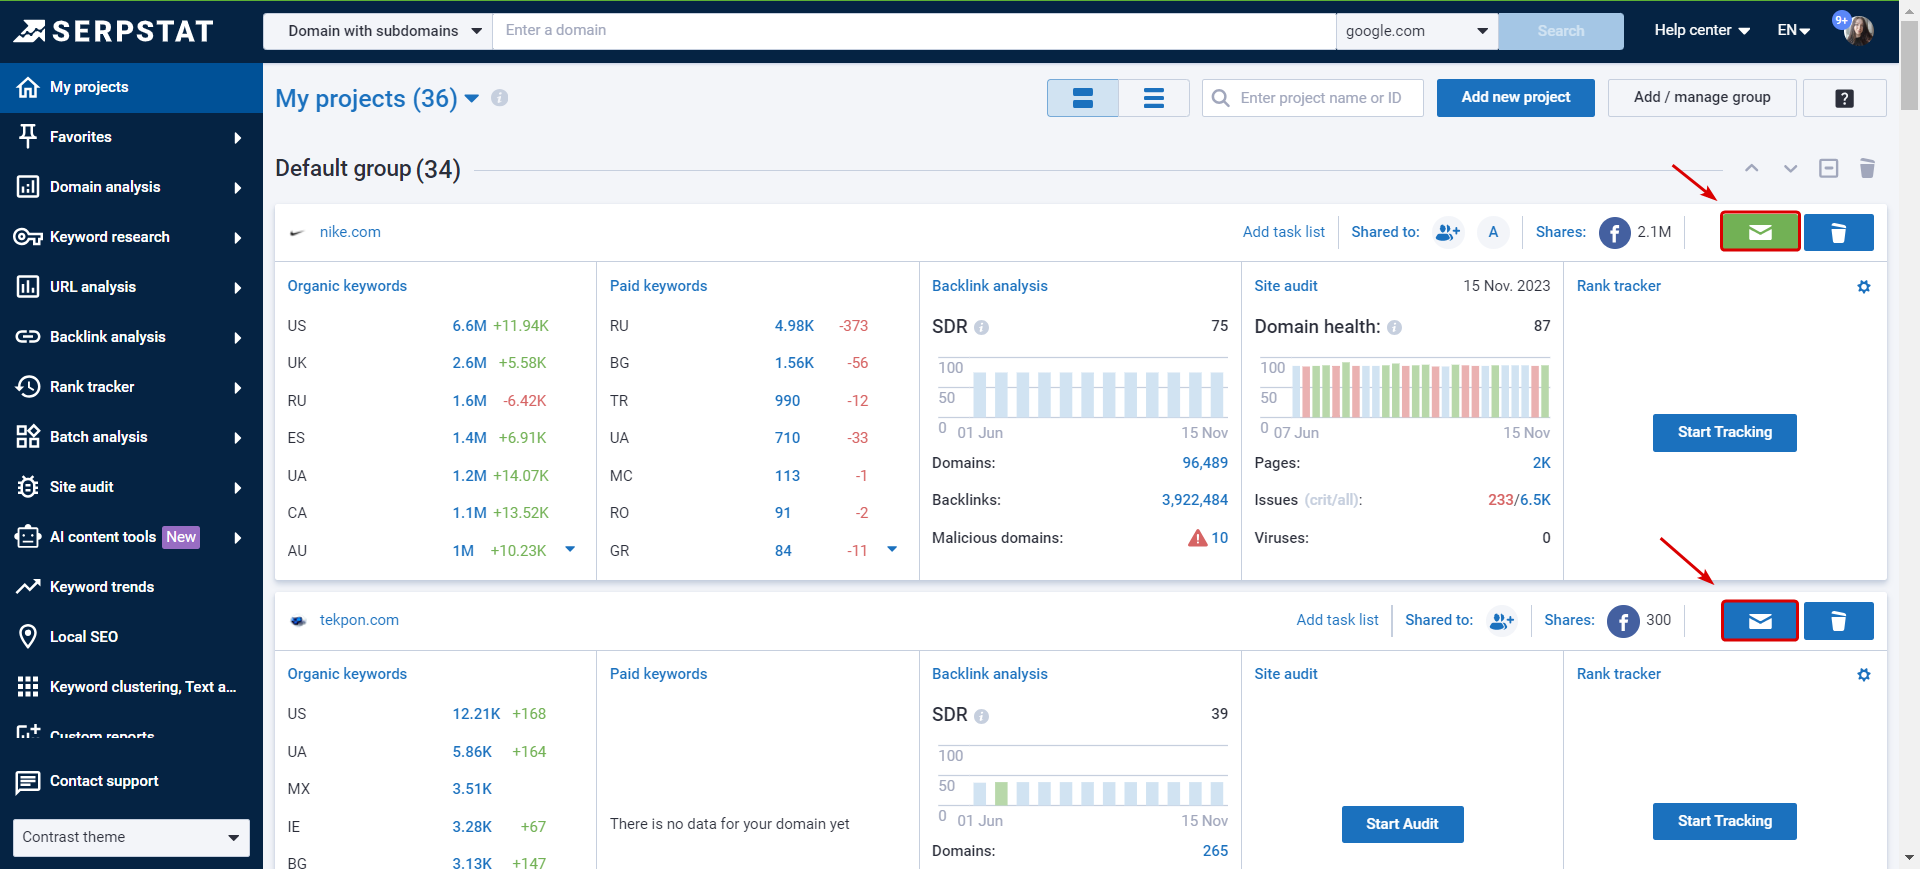
Add up to 5 regions to one Rank tracker mailing list; all updates will be sent in one letter. The mailing schedule has flexible settings: select a specific date or day of the week.
* In the Backlink analysis block you may see a message that "The report is temporarily unavailable." This is due to the fact that the analyzed domain has a large backlink profile, so information for such sites is temporarily unavailable in our service, but it will appear soon.
1. Through the Help Center in the upper right corner, navigate to our Blog, Serpstat updates, Knowledge base, Serpstat Academy, Privacy Policy.
2. Do research in a theme of your choice — Light, Contrast, or Dark.
Still have questions? Contact the tech support chat.