Marketing Metrics: A Complete Guide to Help You Understand Key Performance Indicators


Contents
- Number of Leads
- How to calculate the number of leads?
- Conversion Rate
- How to calculate the conversion rate?
- Return on Investment in Marketing (ROMI)
- How to calculate ROMI
- Monthly Recurring Revenue (MRR)
- How to calculate MRR
- Click-Through Rate (CTR)
- How to calculate CTR?
- Average Engagement Rate
- How to calculate the engagement rate?
- Email Subscriber Growth Rate
- How to calculate the email subscriber growth rate?
- Impressions
- How to calculate the impressions?
Running a business is a journey. Just like a real trip, it has a starting point and an end goal. When you set out on a journey, you launch a navigator to determine your current coordinates, keep track of landmarks, and predict when the next stop will be. When you start a business, you set up an analytics system, allowing you to do the same. Analytics determines the company's position in the market, identifies intermediate benchmarks for your success, and helps you predict when you will be able to achieve your goals.
Your position or coordinates are your business's key metric. These are quantitative indicators that reflect a business's effectiveness in a particular area. They have threshold levels corresponding to success, failure, or stability, allowing you to link certain management decisions to them. Marketing key performance indicators are particularly important benchmarks in a business journey.
According to Google and MIT, 89% of marketers at top companies use strategic success metrics to measure the effectiveness of their marketing campaigns and make decisions:
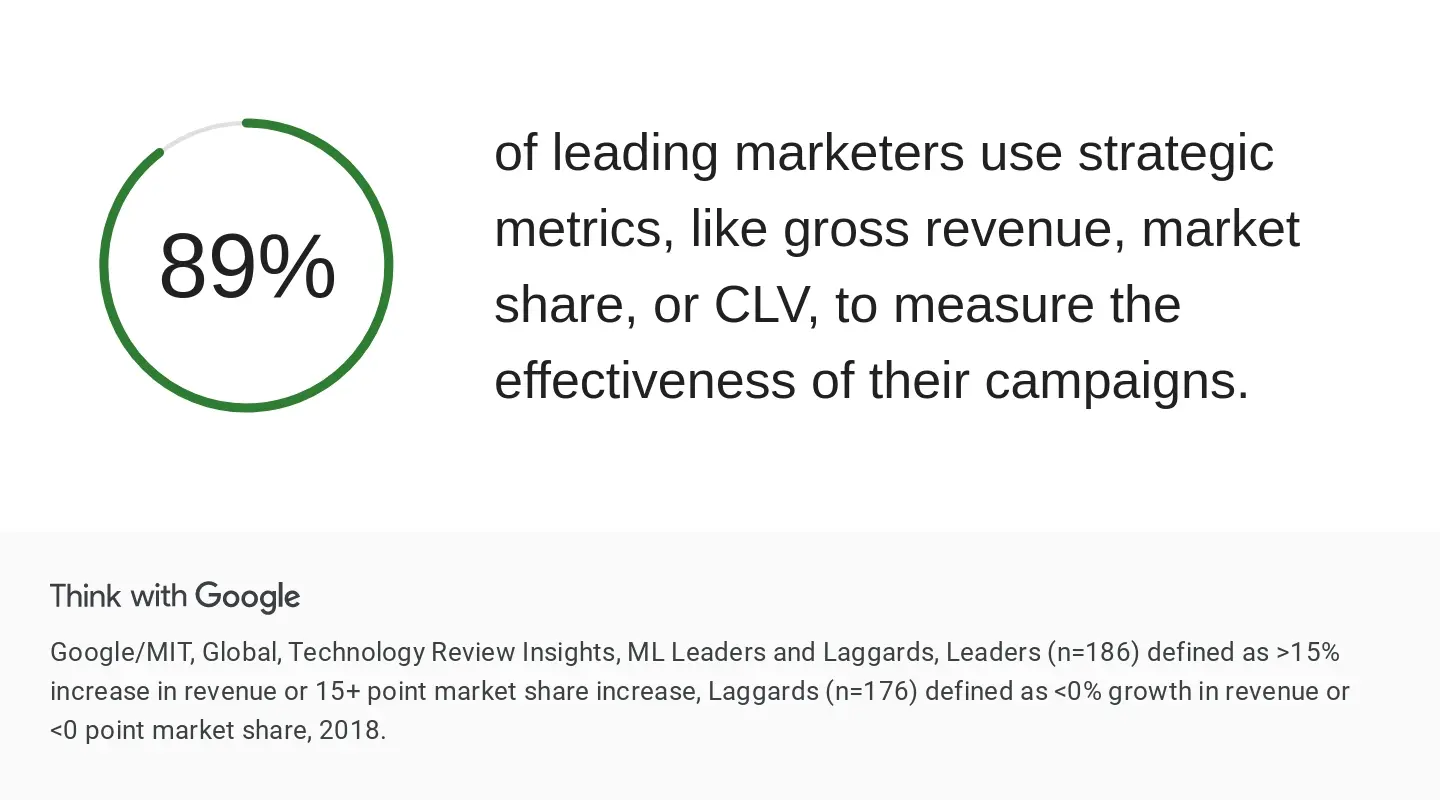
Their example shows that a business cannot unlock its potential without market analytics. So, let's find out what are KPIs for marketing, how they differ from other business metrics, how to calculate them correctly, and how to use them in practice.
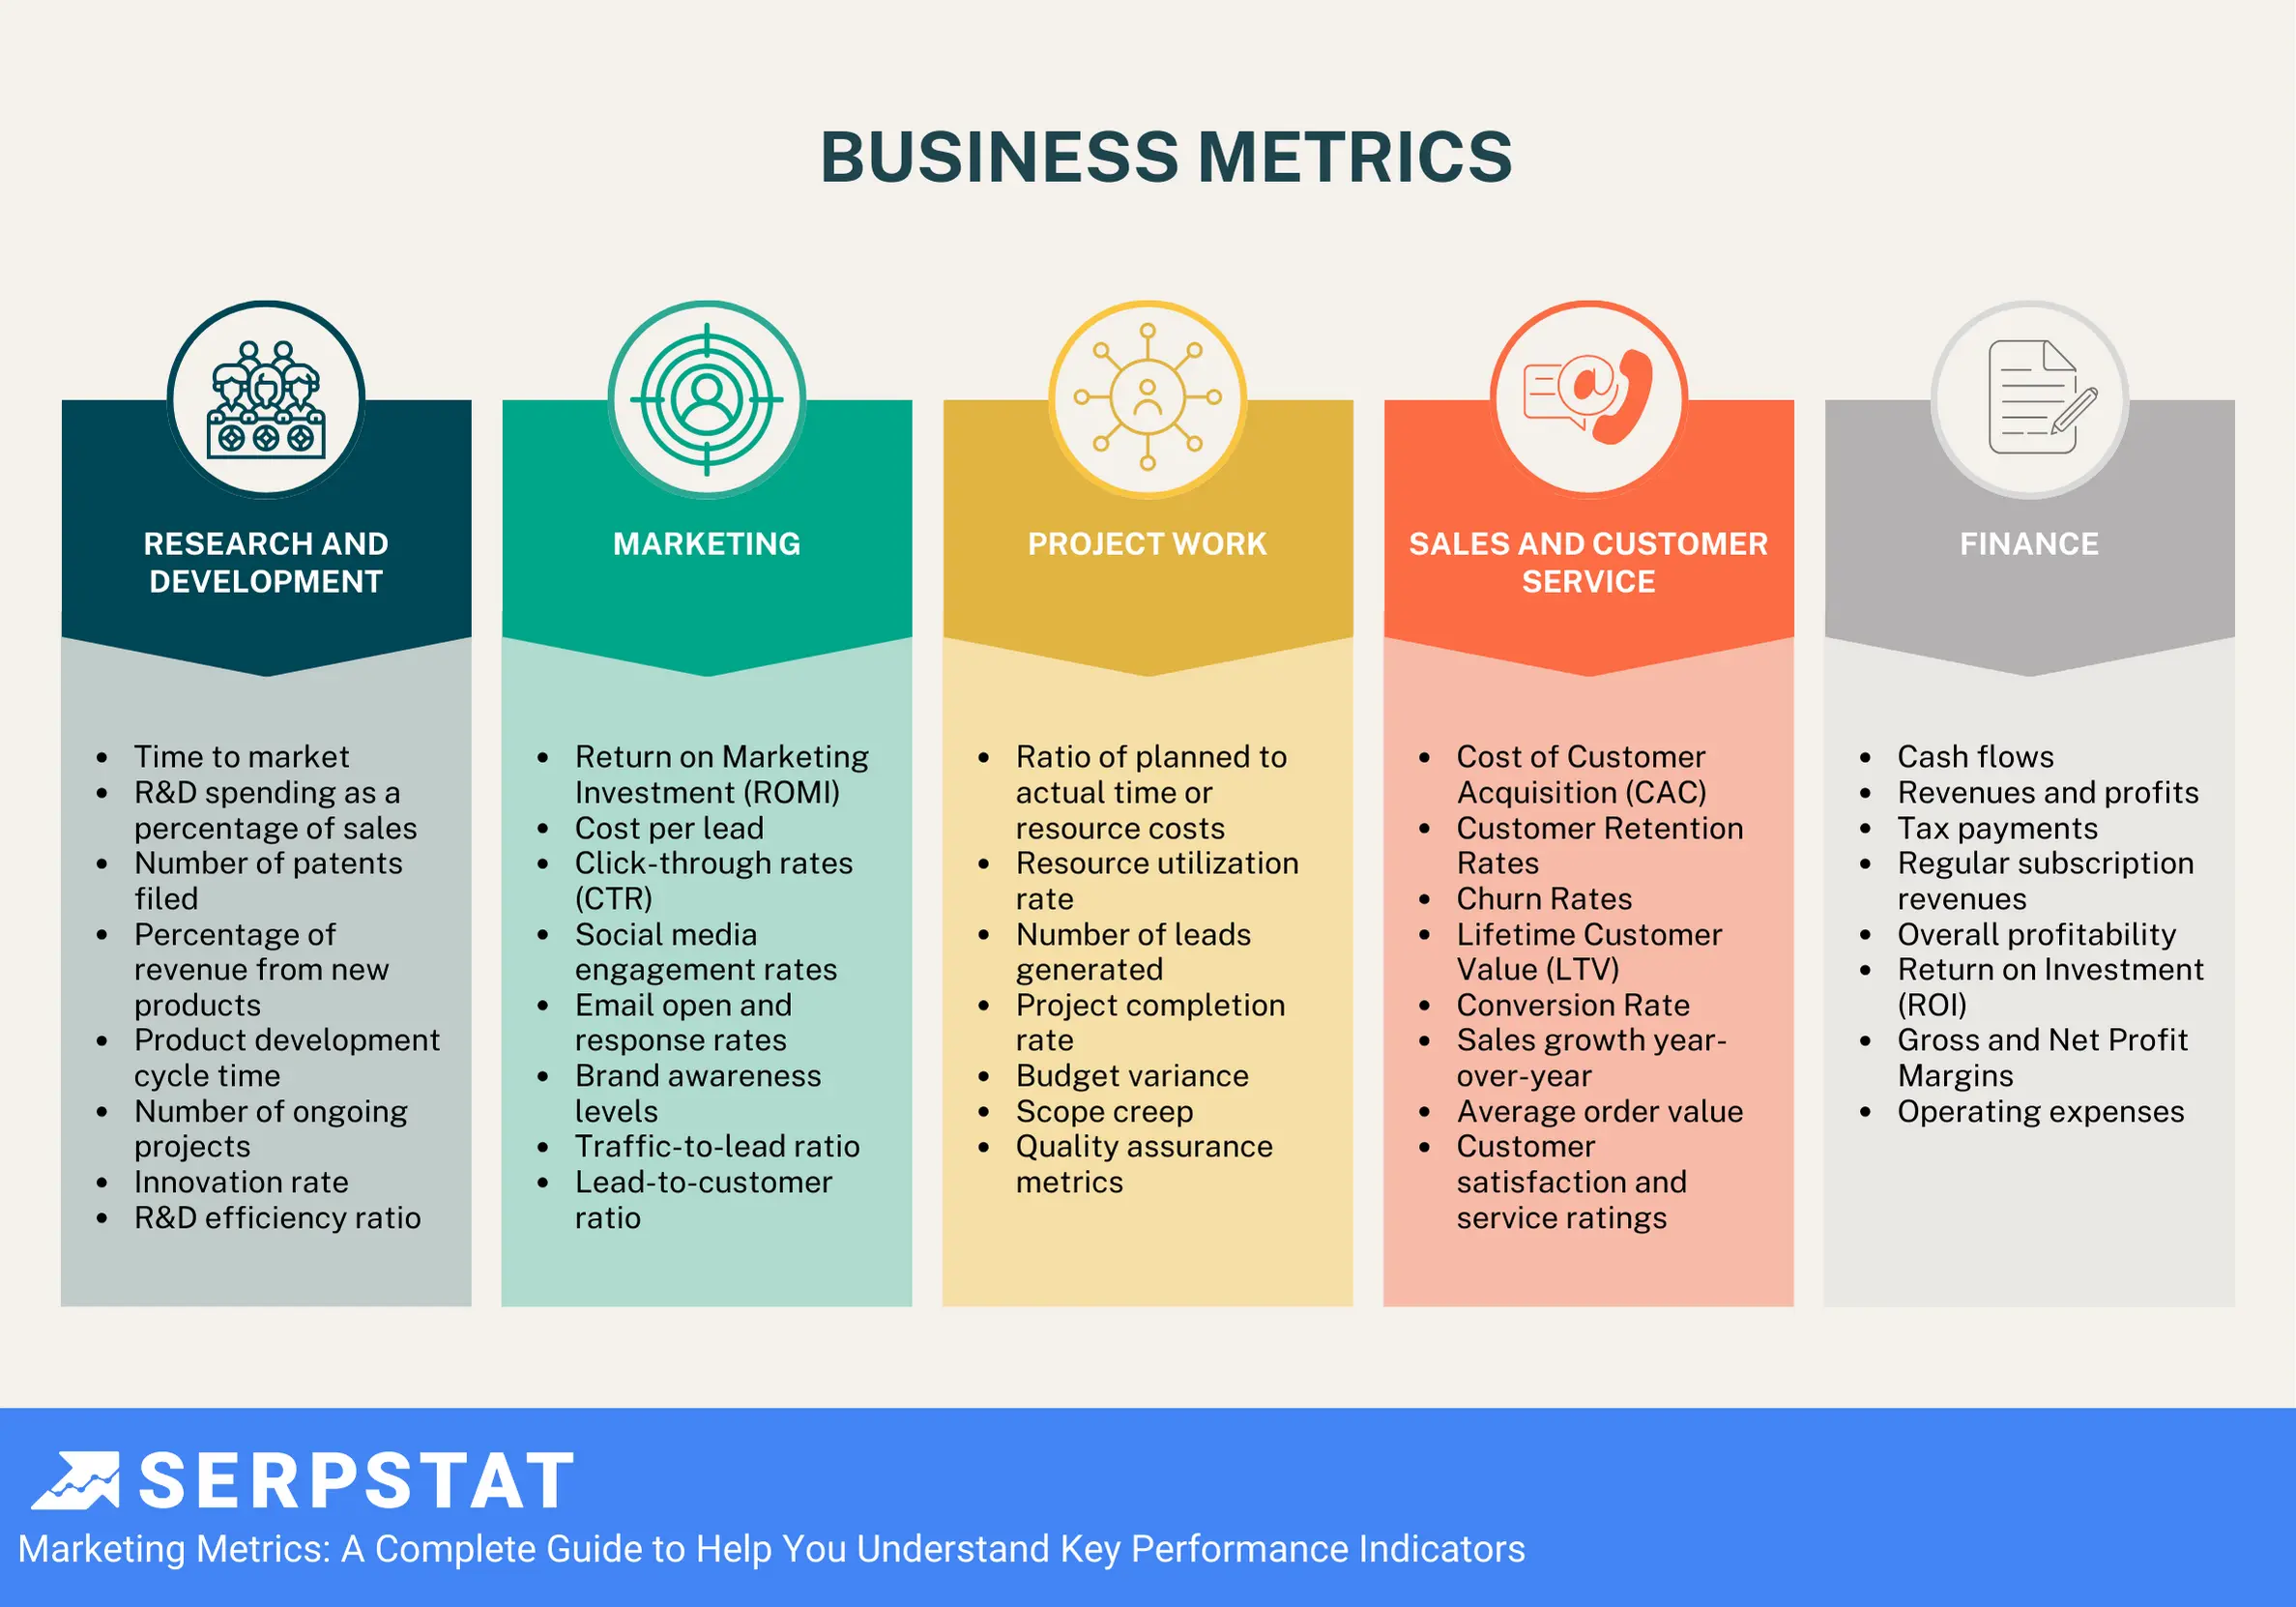
What Are Business Metrics?
Business is always about numbers. Therefore, key metric figures reflect the effectiveness of each area of activity. Logistics is the average cost of transportation and delivery speed within a region or country. Production is the duration of the work cycle and labor costs for manufacturing a product. Accounting is the time it takes to pay bills and the number of errors in reporting. The list can be truly endless, given that each company has its specific workflow.
But the key metrics of a business are considered to be those related to the following areas of activity:
However, performance marketing KPIs are more often discussed at business meetings. In the face of high customer expectations and an even higher level of competition, they are becoming the success metric. And we will tell you more about them.
What Are Marketing Metrics?
Of course, every business has its analytics system. Some people consider sales and profits to be absolute priorities, while others put brand reputation and customer satisfaction first. However, in every industry, there are universal success metrics that should never be overlooked. As an example, let's review the key performance indicators for digital marketing.
Number of Leads
Leads are your potential customers who only have to take the last step to purchase a product. These people have decided to leave their contact information and are ready to discuss your commercial offer. When it comes to metrics for marketing effectiveness, the number of leads is usually evaluated over time, comparing different periods or individual advertising campaigns.
The simplest analytical techniques in marketing are applied to work with leads. More leads are better, and fewer are worse. An increase in the indicator can be a success metric, while a decrease can be a signal to change marketing policy, update the website, or revise the product line.
How to calculate the number of leads?
Metrics measurement is simple — just sum up the number of forms with filled-in contact information. Of course, it is convenient to do this manually only when the number of leads is measured in dozens per month. Even then, you should automate marketing data analysis to prepare for business scaling in advance.
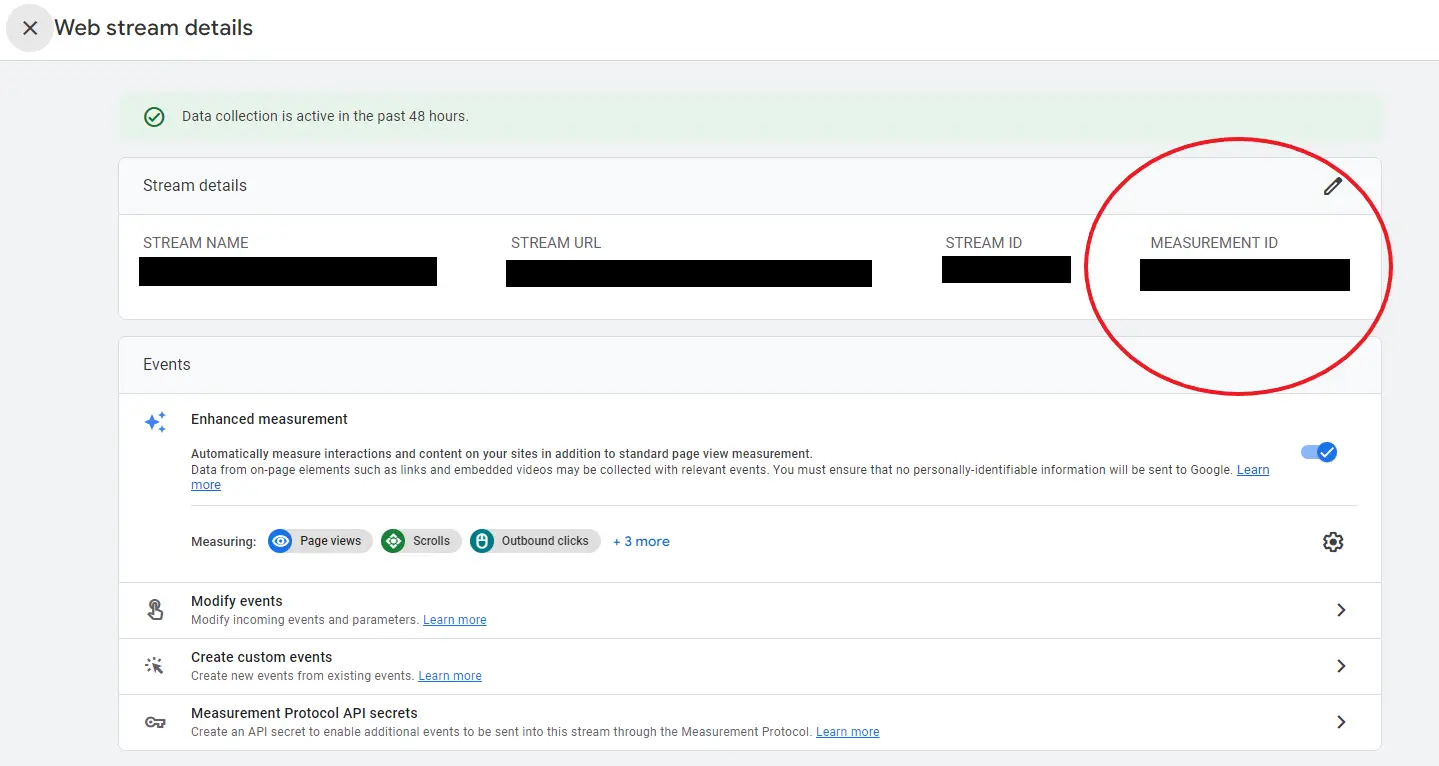
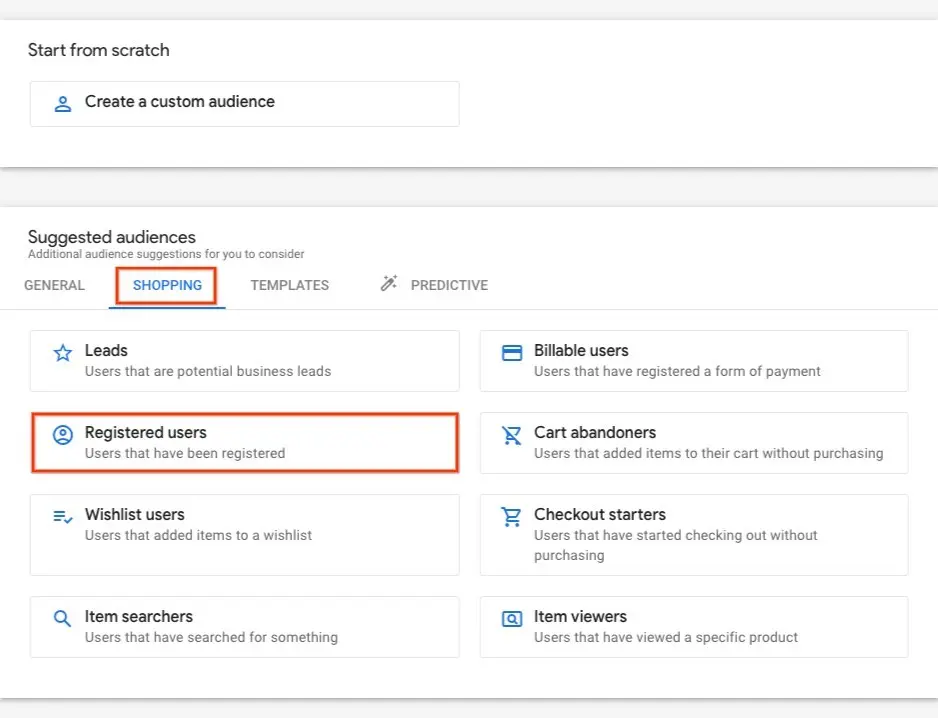
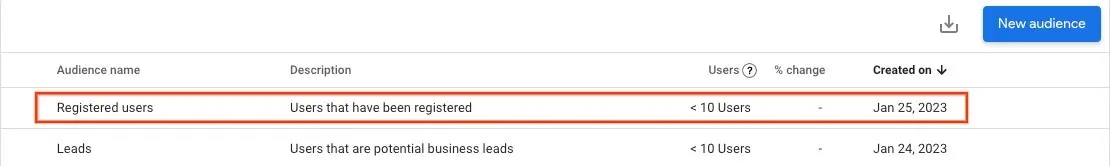
Google Analytics is the perfect platform for metric tracking related to leads. You can set it up as follows:

Conversion Rate
It is one of the examples of KPIs in marketing that remain relevant for any business, regardless of its field of activity. Conversion is the implementation of a targeted action on a website, which can be represented by a sale, form filling, registration, subscription, or file download. The metric meaning in business is best revealed by comparing the actual figure with competitors' figures or industry standards.
The interpretation will be simple — a higher conversion rate corresponds to a better commercial offer, improved customer experience, and enhanced website interface. Therefore, these metrics for digital marketing often serve as an integral indicator of success. If you lag behind your competitors or the market average, it is a signal to revise your marketing policy.
How to calculate the conversion rate?
A fairly simple formula is used to measure metrics:

This KPI for marketing campaign can also be tracked using Google Analytics. Use the following instructions to see it in your reports:

Conversion rate can be calculated not only with Google Analytics. In our article, you can read about the top digital marketing analytics platforms with a wide range of features and user-friendly interfaces.
Return on Investment in Marketing (ROMI)
When you spend time, effort, and resources, you always want to know if it's worth it. One of the key metrics for marketing effectiveness — profitability — will give you the answer to this question. Its calculation is part of the basics of data analysis 101.
Working with such types of metrics is also quite simple. Positive profitability means the investment pays off, and you end up in the black, adding a certain amount to your profit. But it's even more effective to look at examples of KPI in marketing compared to competitors, past advertising campaigns, or the market average. This allows you to determine your current position and business development dynamics.
You can use different profitability metrics types, disaggregating them by:
- individual communication channels;
- brands, products, and websites;
- marketing campaigns.
While ROMI is related to profitability, it focuses explicitly on assessing the effectiveness of marketing campaigns. ROMI compares the revenue generated from marketing efforts to the cost of those campaigns. It helps businesses determine whether their marketing investments yield positive returns.
You can read more about this in our article where we compare SEO, SEM, and PPC, including in terms of ROI.
How to calculate ROMI
Metrics measures are calculated using the following formula:

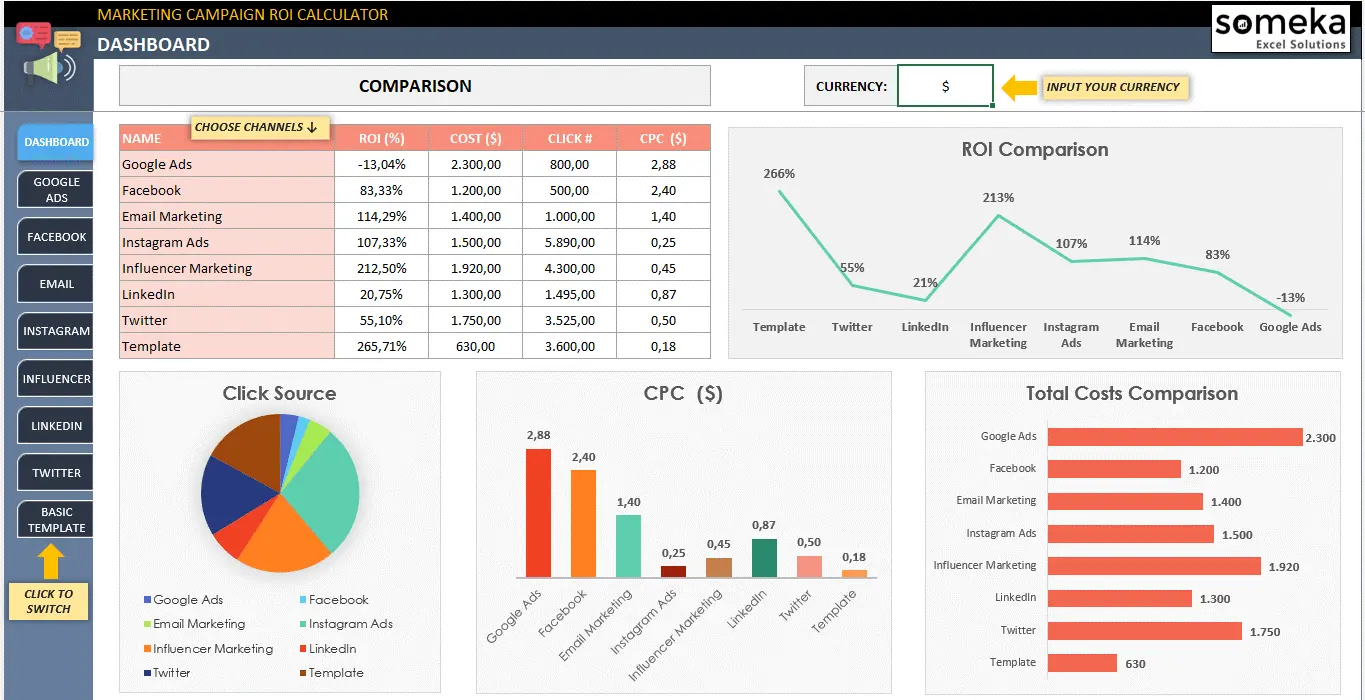
Sometimes, there are no off-the-shelf solutions for calculating these marketing performance indicators. You'll need to combine revenue and expense data, which is usually available from different sources. To do this, you can use marketing analytics and visualization platforms or even Google Looker Studio or Excel dashboard templates.
Source: Someka
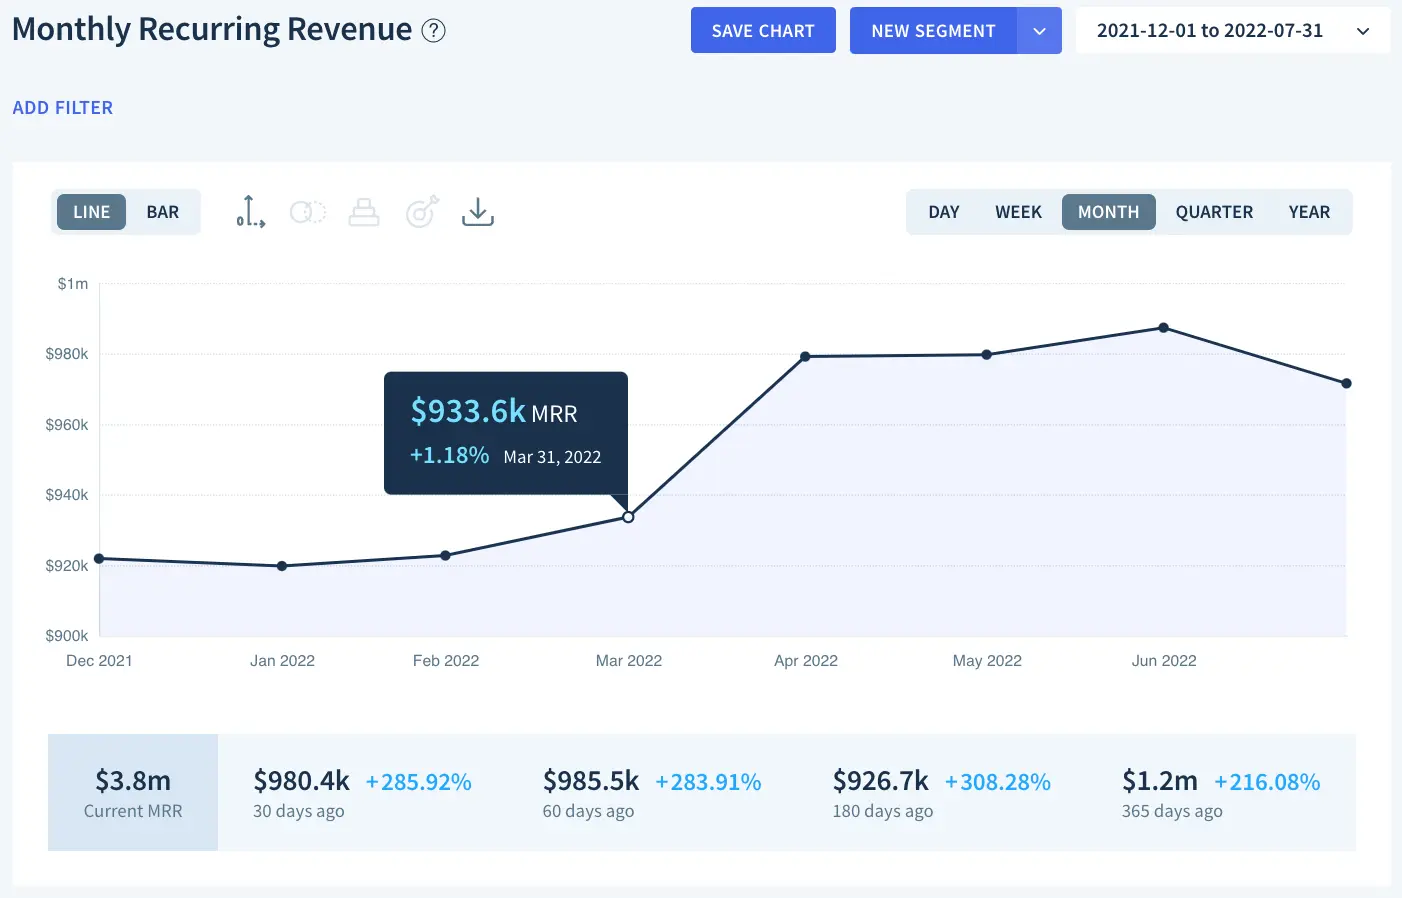
Monthly Recurring Revenue (MRR)
MRR is a business metrics example that will be especially useful in a certain industry, more specifically, in the SaaS and subscription services segment. If you offer your users an AI platform for text generation or sell coffee with regular delivery, you need to know what kind of recurring revenue you can count on. Tracked metrics allow you to make forecasts for the future, draw up financial plans, and build a company development strategy.
MRR belongs to the types of metrics that are best analyzed in dynamics. Steady growth will mean the right choice of marketing policy, while a decline in revenue will indicate problems. But abnormal spikes can also be an alarming signal — they often indicate the beginning of marketing trends you didn't expect, unfair actions of competitors, or uncontrolled information dissemination.
How to calculate MRR
There are two ways to conduct this marketing measurement. The simplest is to summarize the cost of all subscriptions. You can also divide metrics and measures into components:

This approach helps you know how to analyze marketing data better. It allows you to understand whether the dynamics are driven by extensive or intensive factors. For example, if the overall MRR is increasing, it's fine. Similarly, a positive measure of success examples would be an increase in the average subscription cost, which would mean that customers are switching to premium subscription plans. But against this backdrop, you can easily miss a decrease in the number of subscriptions, which is a downside that requires immediate attention.
MRR can be calculated using analytics platforms in the same way as other digital marketing metrics. Specialized financial accounting applications are also a good alternative.
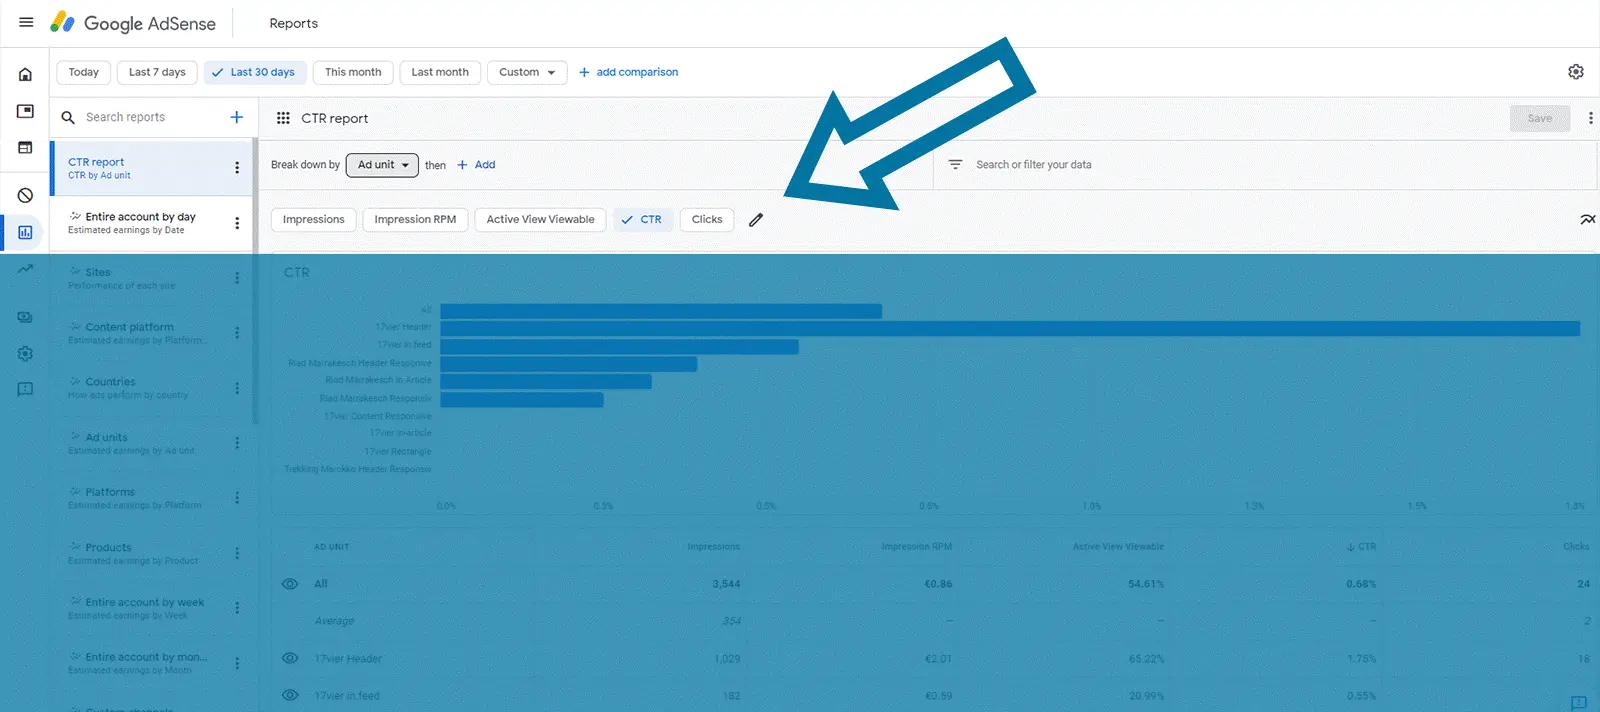
Click-Through Rate (CTR)
How to understand that customers like your commercial offer? It's easy — see how many of them wanted to read its details by clicking on the link. This brings us to one of the key email marketing metrics for SEO and contextual advertising — CTR.
It is one of the marketing KPI examples that can only be interpreted in comparison with the market average. A high CTR for financial services can be considered low in retail, and excellent performance for a travel business can be considered too weak for the SaaS industry. When considering this online marketing KPI, you should also take into account the communication channel you choose. Email newsletters still have a high CTR, while in SEO, it rarely exceeds 5-10%.
How to calculate CTR?
The calculation of this metric in business is quite simple:

You can find mechanisms for marketing measurement on most analytics, contextual advertising, and email marketing tools. For example, Google AdSense has a separate report dedicated to CTRs.
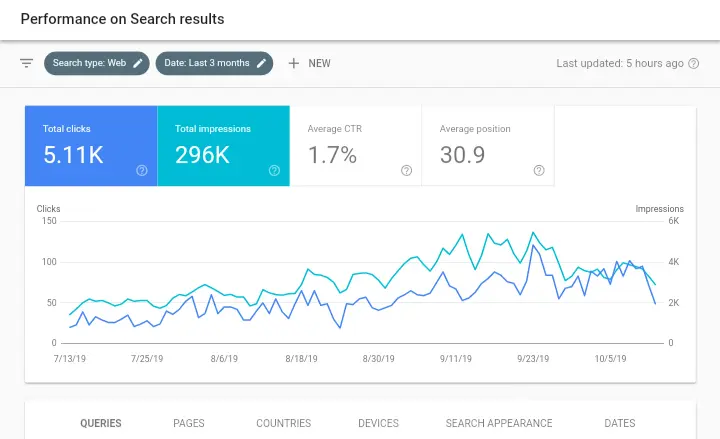
You can also see the CTR for organic traffic in the main dashboard of Google Search Console.
Moreover, you can link its calculation to events in Google Analytics using Google Tag Manager. CTR is one of the top 10 marketing KPIs, which you can learn more about in this article.
Average Engagement Rate
People can interact with your brand not only because they are interested in its commercial offer. Someone came to the site by accident, someone immediately responded to a post on social media, and someone clicked on a link on purpose to worsen your performance. If you know what are marketing metrics used to determine engagement, you can easily distinguish between those visits and the useful ones.
Engagement is a complex indicator calculated individually for each communication channel. To get examples of KPIs in marketing, you should familiarize yourself with the rules of a particular platform, such as Google Analytics, Facebook, Twitter, etc.
How to calculate the engagement rate?
At first glance, this business metric is simple. Its formula looks like this:

But what marketing metrics meet the criteria of an engaged session? You can find the answer in the instructions of a particular platform. For social media, engagement usually means sharing posts, reactions, and comments under them. Google Analytics takes a different approach. The platform considers all sessions to be engaged if at least one of the three conditions is met:
- A user stays on the site for more than 10 seconds;
- A visitor views at least 2 pages;
- A user makes a conversion.
By default, this metric is not available in Google Analytics reports. But you can add it to your sales and marketing KPIs as follows:
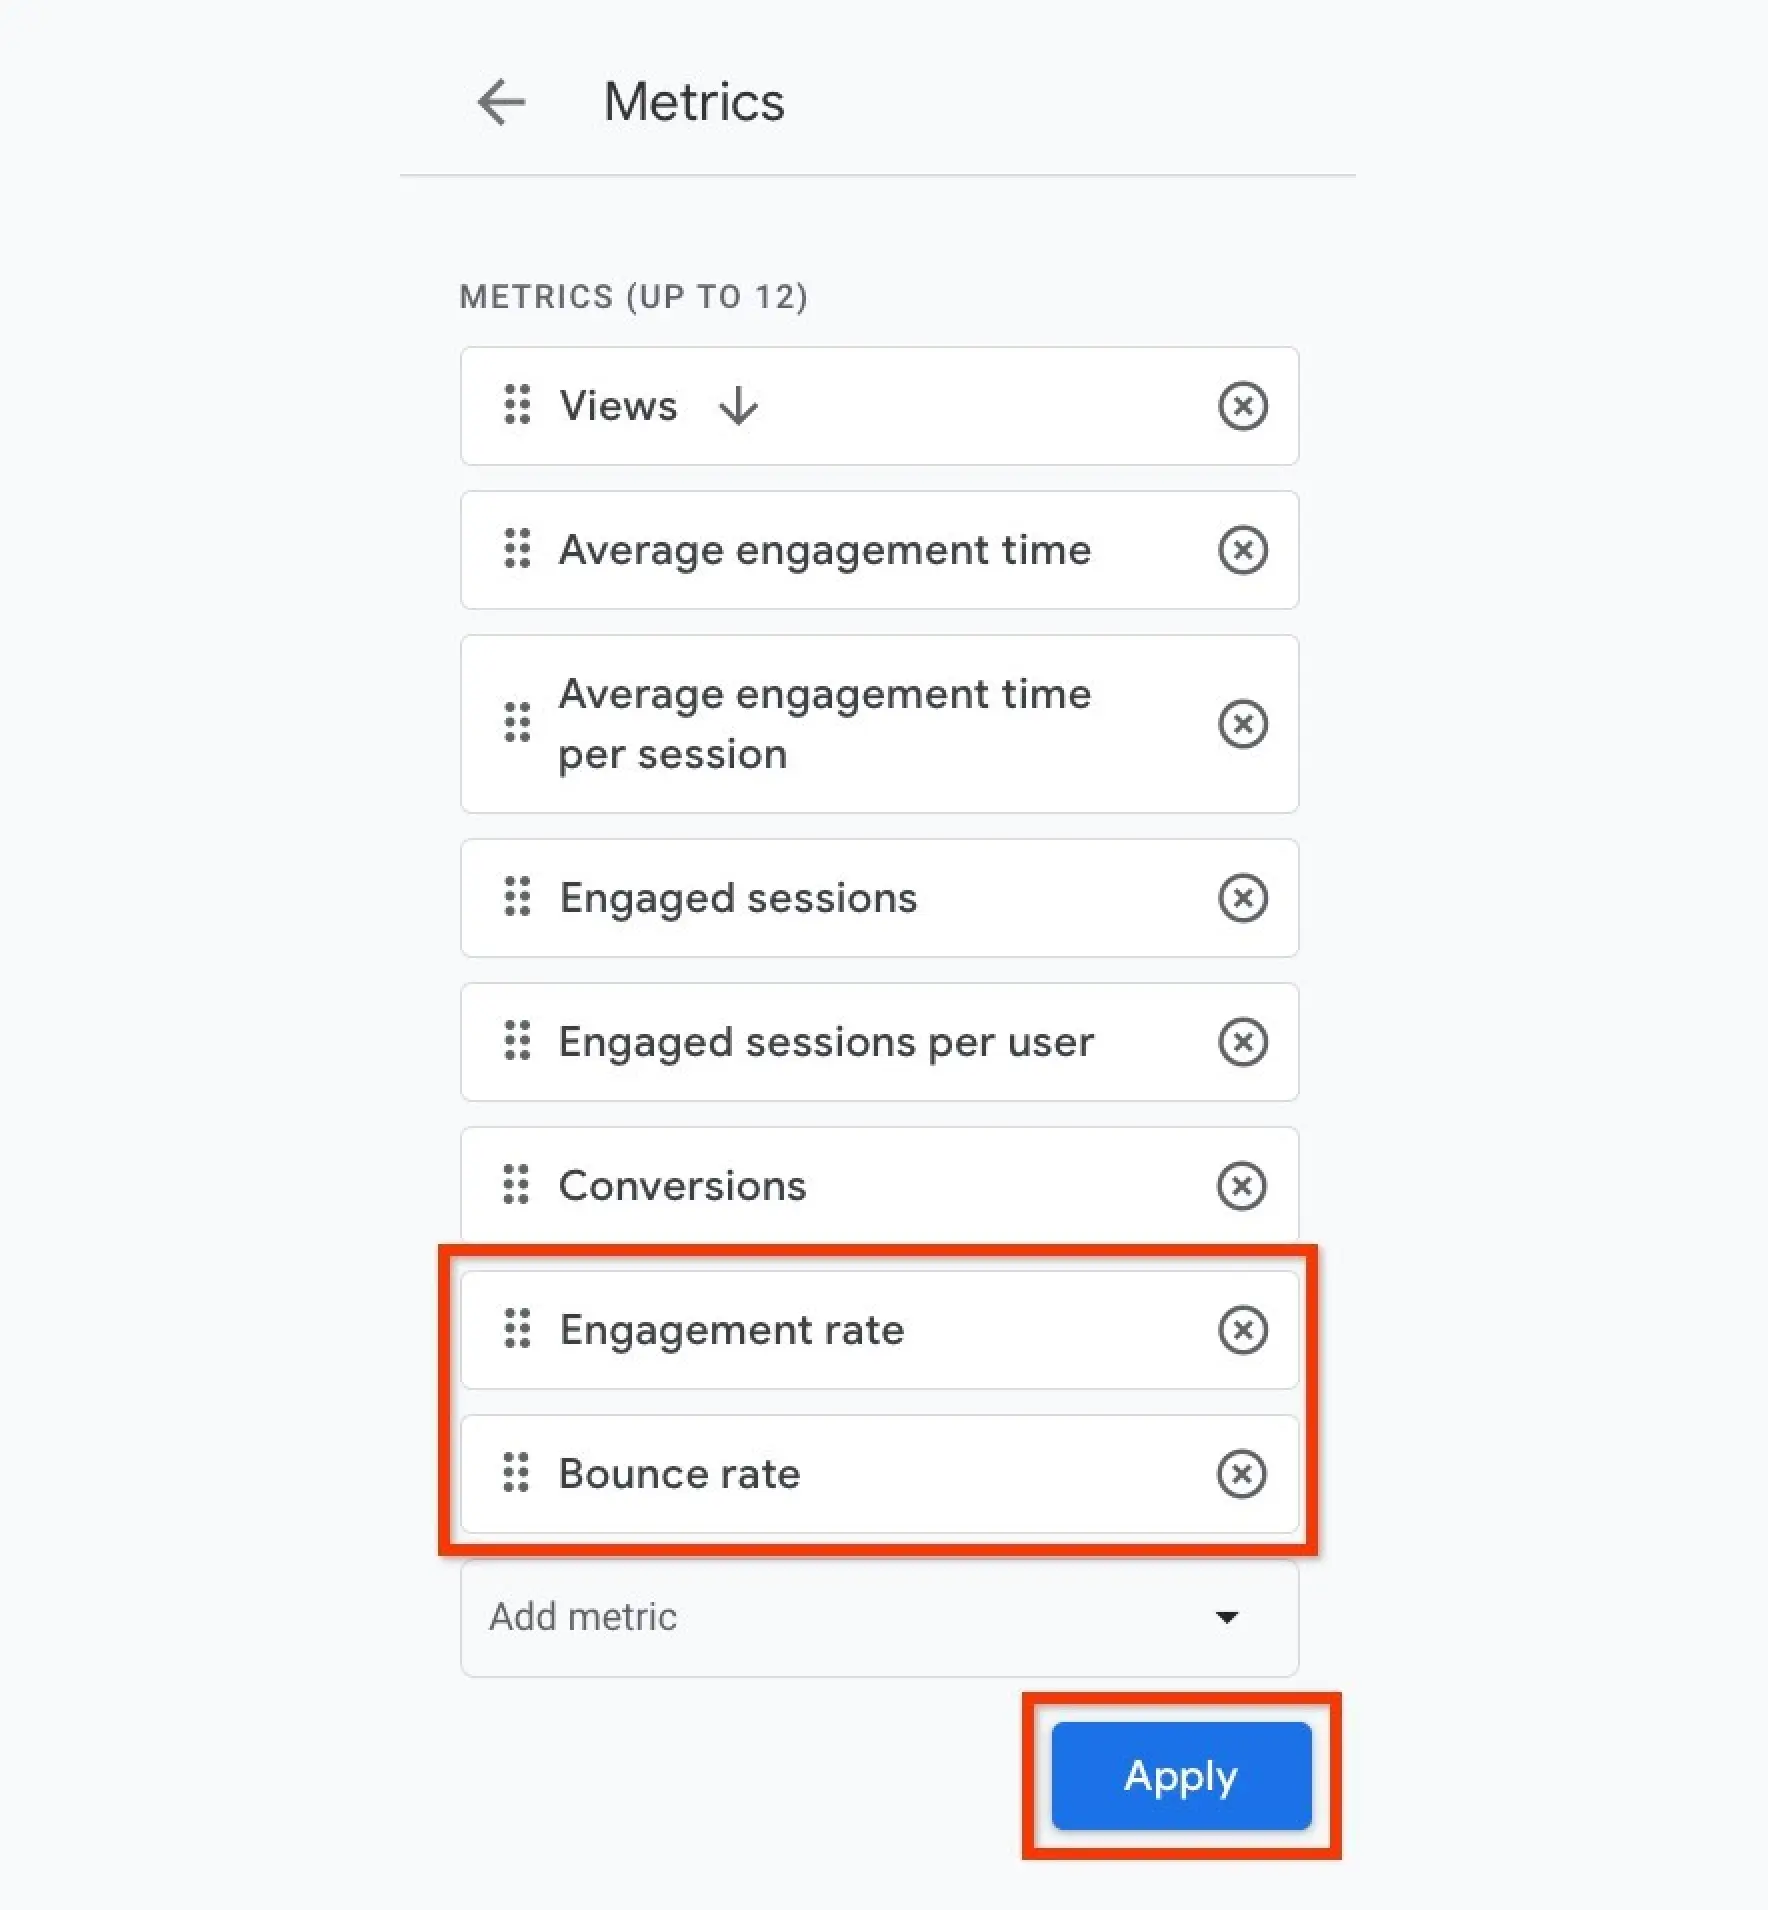
If necessary, you can also add a bounce rate that is inversely proportional to the engagement rate.
Email Subscriber Growth Rate
If your business model involves organizing newsletters, the number of subscribers will be one of the key email marketing metrics for you. And, as always, it's best to look at it in the dynamics — in terms of weeks, months, or individual advertising campaigns. Therefore, we will be interested not in the absolute number but in its growth.
A stable growth in the number of subscribers is good. But you should pay special attention to abnormal indicators. These metrics types can teach you a lot. Too-low metrics will show you what to avoid in future campaigns, while too-high metrics will indicate the needs and interests of your target audience.
How to calculate the email subscriber growth rate?
Marketing analytics uses the following formula:

It's an example of metrics in business available on most analytics platforms. You can calculate it both with the help of email marketing services and in Google Analytics. Let's consider the latter option:
Impressions
The discussion about what key metrics are used in marketing will be incomplete without impressions. In fact, it is an indicator of the reach of your campaigns across different communication channels, whether SEO, SMM, or PPC. But by itself, it is as crucial for business as the number of coffee shops in a city per square kilometer. Is it a lot or a little, bad or good? You need context.
If you know what marketing analytics is, you already understand that impressions are correlated with the number of clicks and other targeted actions to get click-through rate, lead engagement rate, or conversion rate. It is also used to compare marketing campaigns or even individual social media posts. Industry benchmarks and competitor data will also provide you with a lot of valuable information. In this article, you can read more about conducting market research with Serpstat.
How to calculate the impressions?
Impressions are among the basic tracked metrics on most analytics platforms. When it comes to SEO, you can see it in Google Search Console.
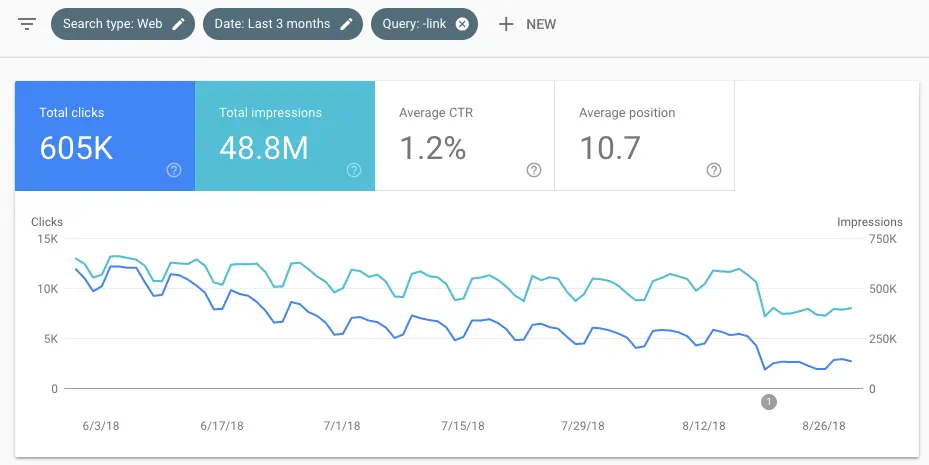
The system provides both generalized information and more detailed reports. It allows you to select impressions by geographic factors, communication channels, and device types.
Conclusions
If we continue with the analogies, a business can be compared to a car. Analytics is its engine. It is not visible from the outside but is the most essential component ensuring movement towards the goal. Data in the form of marketing metrics is the fuel that powers this movement. It is difficult to overestimate the importance of metrics in business. They allow you to make decisions based on facts rather than intuition and guesswork.
Just as it is important for a car to choose the right fuel, it is also crucial for a business to compile the right set of key performance indicators. Examples of metric types also include user satisfaction, NPS, lifetime customer value, repeat purchase frequency, cost per lead, etc. This list should definitely include universal metrics such as impressions, conversion, engagement, click-through rate, number of leads, profitability, and recurring revenue. However, the full set of metrics will be much broader, and its content will depend on the needs of a particular company.
Frequently Asked Questions
Marketing metrics provide valuable insights into the current state of the company, its position relative to competitors, and the characteristics of the target audience. They allow you to make management decisions based on accurate data, not guesswork.
The main rule is that marketing metrics should be aligned with the business's strategic goals. They should serve as indicators that allow you to assess the degree of achievement of these goals and the speed of progress.
Most often, businesses rely on metrics such as the number of impressions, conversion rate, click-through rate, engagement rate, profitability, recurring revenue, and number of leads. However, each company's full set of KPIs is determined individually according to its needs.
Check the main SEO KPI using Serpstat!
Get organic traffic, visibility, keyword ranking, and more
7 days for free
Discover More SEO Tools
Serp Crawling
Scrape Google SERP and analyze
Connector With Looker Studio
Connect to Looker Studio and create reports with data visualization
Bulk Keyword Analysis
Revolutionize your keyword research process with our bulk keyword checker
Keyword Difficulty Tool
Stay ahead of the competition and dominate your niche with our keywords difficulty tool
Recommended posts
Cases, life hacks, researches, and useful articles
Don’t you have time to follow the news? No worries! Our editor will choose articles that will definitely help you with your work. Join our cozy community :)
By clicking the button, you agree to our privacy policy.