Start Exploring Keyword Ideas
Use Serpstat to find the best keywords for your website
How To Test Bids In PPC Advertising Without Applying Them


The following factors influence theoretical sensitivity:
As a result, A/B testing:
- is not accurate;
- takes much time;
- requires a lot of work and specific knowledge;
- cannot be fully automated.
And after all, there is always a possibility that new rates will work worse.
However, since we don't know the dependence of the number of clicks and CPC on the rate, then this metric will produce quantitative results with a rather large margin of error, but possibly quite accurate qualitative results.
In other words, this metric will answer the question "Which option is better?" Rather well, but rather poorly on the question "How much better?".
Intermediate calculations may seem voluminous to you, but the final formula will be short.
For the sake of simplicity, let's assume that each keyword has:
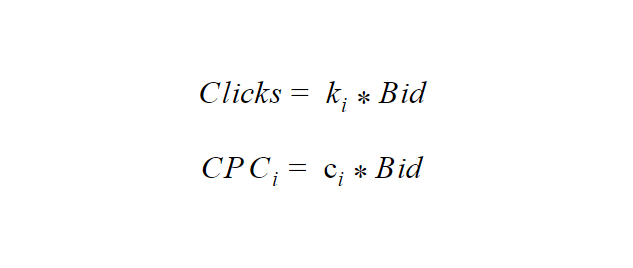
CPC and number of clicks are proportional to the bid;
conversion probability is independent of the bid.

f - forecast the probability of conversion
L is a constant to fit our constraints (budget, target CPA)
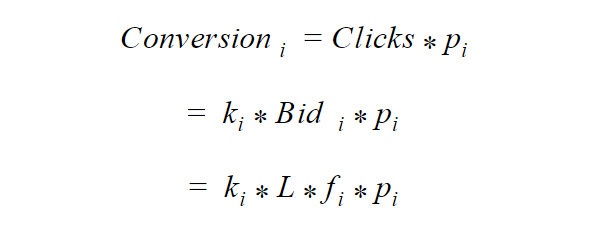
Let p be the probability of conversion, then the expected number of conversions is:
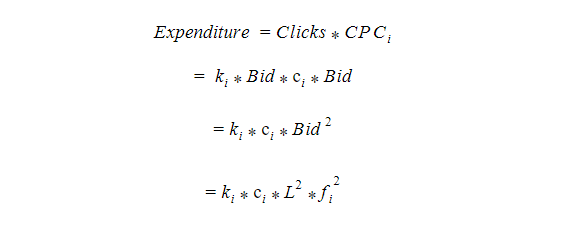
The expected CPA is:
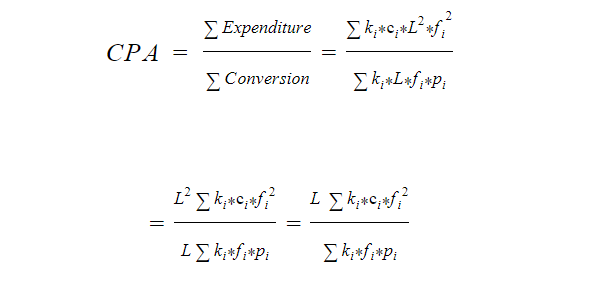


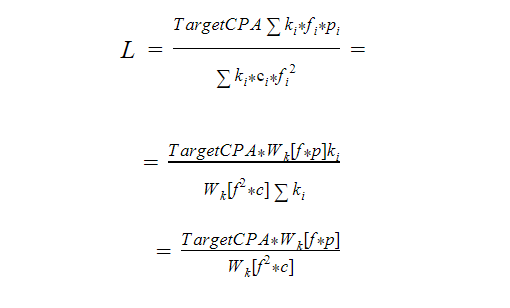
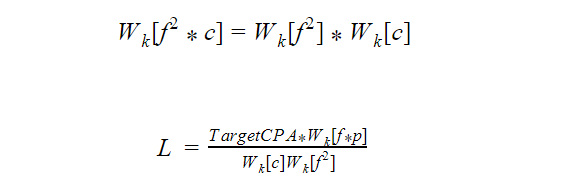
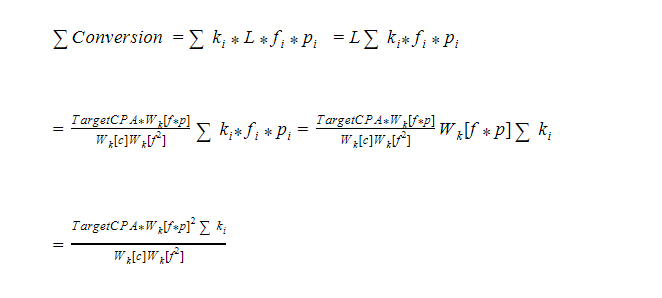
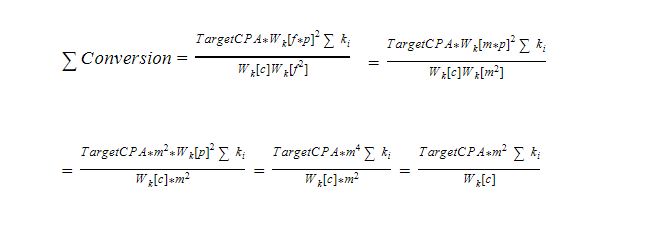


W [fp] - grows with an increasing correlation between the estimate and the probability of conversion. It also grows with bid variance (spread).
W [ff] - grows with increasing variance of bids.
IBIF can be expressed in terms of rate variance and the correlation between bids and estimates.

C is Pearson's weighted correlation coefficient between bids and predictions. The measure of the adequacy of the bids doesn't exceed 1. Equal to 1 for an ideal estimate, equal to 0 for random rates.
V [] - weighted relative variance, the measure of the spread. Greater than or equal to zero. For example, if V [f] = 0, it means that all bids are the same. V [p] <1 is almost certainly true. Usually V [p] is about 0.5. V [f] is usually not very different from V [p].

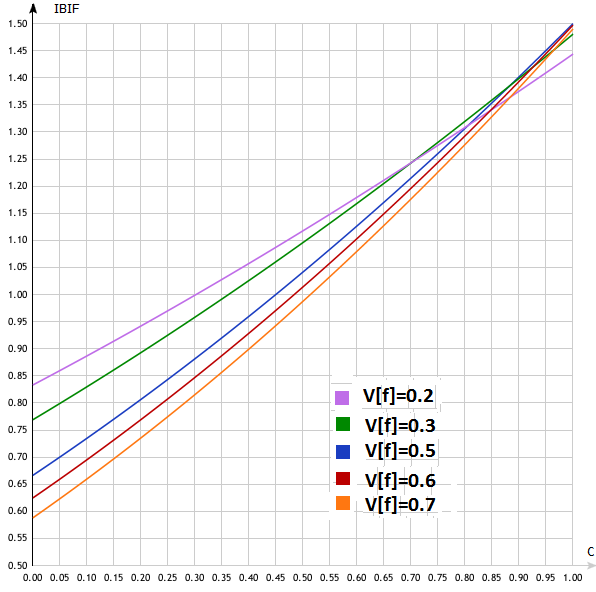

From the fact that it is almost certain that V [p] <1, we get that the IBIF is almost always less than 2. The opposite indicates, most likely, that a significant number of keywords have almost zero conversion (much less than the average for the site).
This can happen, for example, when you buy most of the clicks on products you don't have in stock, on 404 pages, or irrelevant pages; or some of the pages don't have a conversion tracking code.
In other words, IBIF > 2 may indicate that rates solve some specific problem.

r - keyword conversion rates
n - number of clicks on keywords
Note that f should not directly depend on r. That is, f and r must be calculated at different periods.
In other words, you need to run the test like this:
For example, on the 1st day we withdraw bids or calculate the forecast. Remember f.
After a couple of weeks, for example on the 16th, we take data from the 2nd to the 15th. And we get n and r.
We calculate the IBIF, the variant with the higher IBIF is considered the winner.
Since we don't apply bids, we just look at the statistics, we will call this test passive.
If we multiply f by some constant factor S that is the same for all keywords, then the IBIF will not change:


r - conversion rate for the first period (regular rates are considered in this period)
n - number of clicks in the first period
R - conversion rate for the second period (periods should not overlap)
If you don't have a second period, then you can divide the first period into 2 parts (equal) then:
r - conversion rate in the first part
R - conversion rate in the second part
n - number of clicks for the entire period
This formula doesn't depend on uniform seasonality when the conversion of all keywords decreases or increases by the same number of times.
The accuracy of calculating the limiting IBIF for small data is several times less than that of a conventional IBIF.
However, the rule V [p] <1 and IBIF <2, in this case, may not be observed.

Seasonality accounting can also be evaluated.

r - keyword conversion rates or revenue-to-click ratio
n - number of clicks on keywords
f - bids or forecast for conversion or revenue per click. When calculating them, data for the period for which r was taken should not be used.
W [] average weight operator


n (clicks) are in column A
r (conversion) are in column B
f (forecast/bids) are in column C
Then the formula will look like this:
(A1:A,B1:B),2)*SUMPRODUCT(A1:A,C1:C,C1:C))
SUMPRODUCT(A1:A,C1:C,C1:C))

Speed up your search marketing growth with Serpstat!
Keyword and backlink opportunities, competitors' online strategy, daily rankings and SEO-related issues.
A pack of tools for reducing your time on SEO tasks.
Discover More SEO Tools
Keywords Grouping
Streamline your SEO efforts with our advanced clustering keywords tool
Search Google Trends
Unlock the power of your target audience's searched keywords with our keyword trends
Keyword Volume Checker
Bulk Keyword Volume Checker – get valuable information about your target keywords
Tools for Keywords
Keywords Research Tools – uncover untapped potential in your niche
Recommended posts
Cases, life hacks, researches, and useful articles
Don’t you have time to follow the news? No worries! Our editor will choose articles that will definitely help you with your work. Join our cozy community :)
By clicking the button, you agree to our privacy policy.
