26735
How-to 9 min read August 15, 2019

How to analyze user behavior and location history on the website

It is useful to analyze heat maps and location history for users on a website to find out what steps users perform before target actions. This will help simplify Customer Journey Map and increase conversion.

What are user website locations?

User location is the user's navigation from one page to another before performing a target action or dropping-off a project. These locations include returns to previous pages, as well as deviations from the intended flow.While analyzing the visitors' behavior, we can come up with an idea of how comfortable the website is and whether it effectively resolves the user's problems at different stages of the sales funnel.Frequent returns, long chains of different locations before target events or sudden drop-off from the resource indicate that navigation and project usability require improvements.

How to analyze the users' location history on the website

Google Analytics Reports

Google Analytics allows you to track the location of visitors on the website, analyze the events launched, see the entry and exit points of users. This information is given in several conversion maps.

Google Analytics Behavior Flow and Analysis
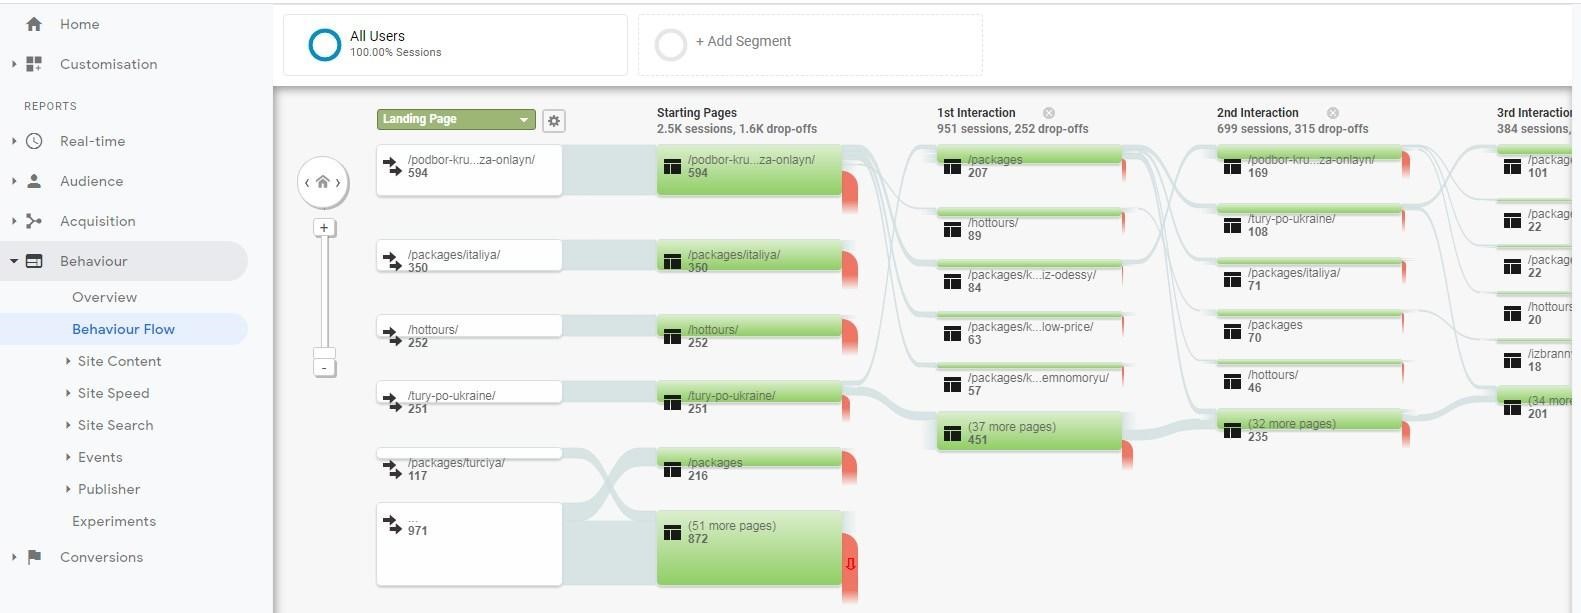
Go to the section "Behavior" - "Behavior Flow":
Google Analytics Behavior Flow
This report displays user navigation from one page or event to another while displaying entry and exit points. Here you can see which sections of the website are the most popular among visitors.

Also, the report will help to identify any issues with the materials, for instance, finding pages with high drop-offs rates.

The report also shows the number of visits grouped by the traffic source in order to understand which search engine or website attracts the maximum number of customers:
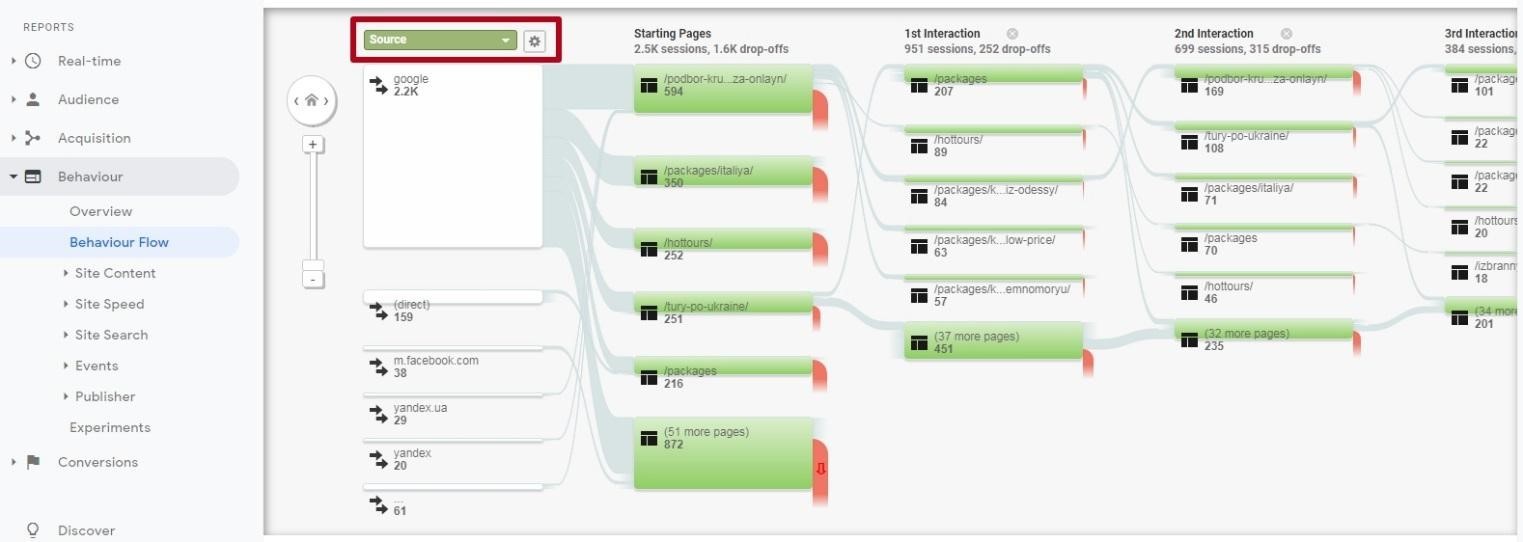
Interaction report in Google Analytics
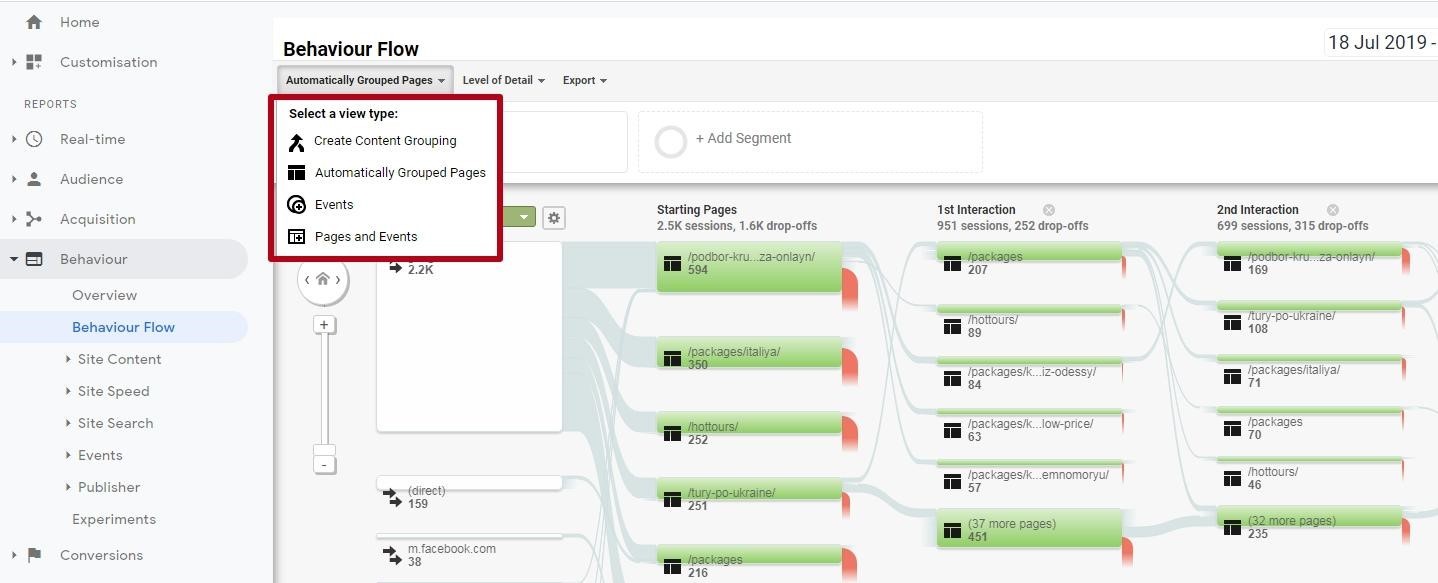
You can select a view type in the report: automatically grouped pages is set by default, alternative options are "Events", "Pages and Events" or "Create Content Grouping":
content groups in Google Analytics
In order to track certain events on the website, such as video views, clicks, file uploads, you need to add the tracking code according to the instructions. Content grouping is used to analyze materials combined by a specific criterion.

For instance, on the books website you can compare the number of downloads of fiction and scientific literature by creating appropriate content groups. At the same time, you can create separate groups: novels, poetry, detectives, etc. within each section.

Each content group has information about page views and drop-offs rates. To analyze content groups, you need to choose one of three options: add tracking code, use regular expressions or rules.

The report also allows you to view the visitors' location history of a particular segment; for instance, returned users or customers who have previously made a purchase. You can set a desired segment by clicking "Add segment":
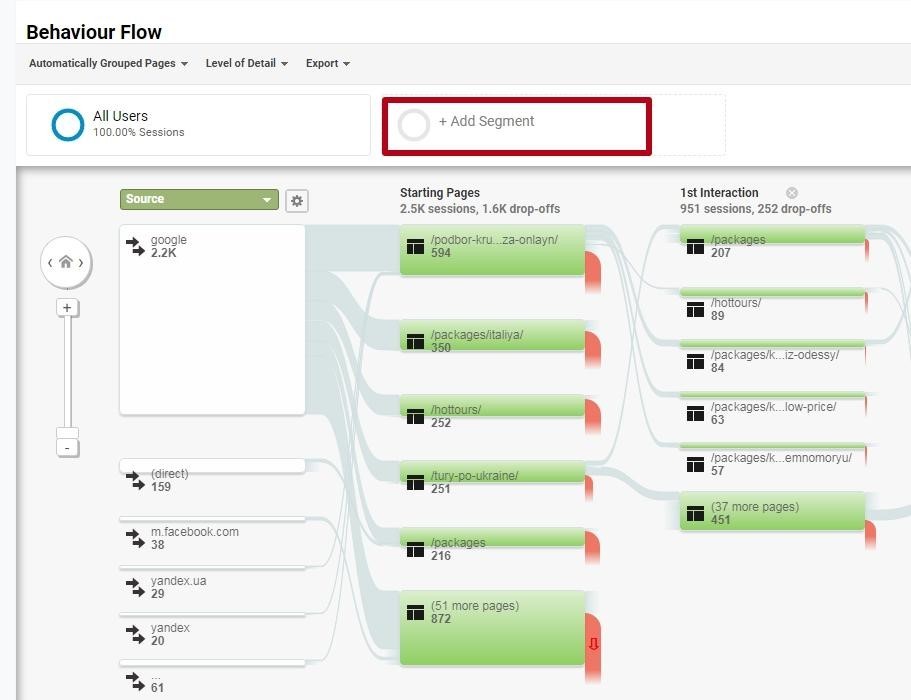
Add segment to Google Analytics
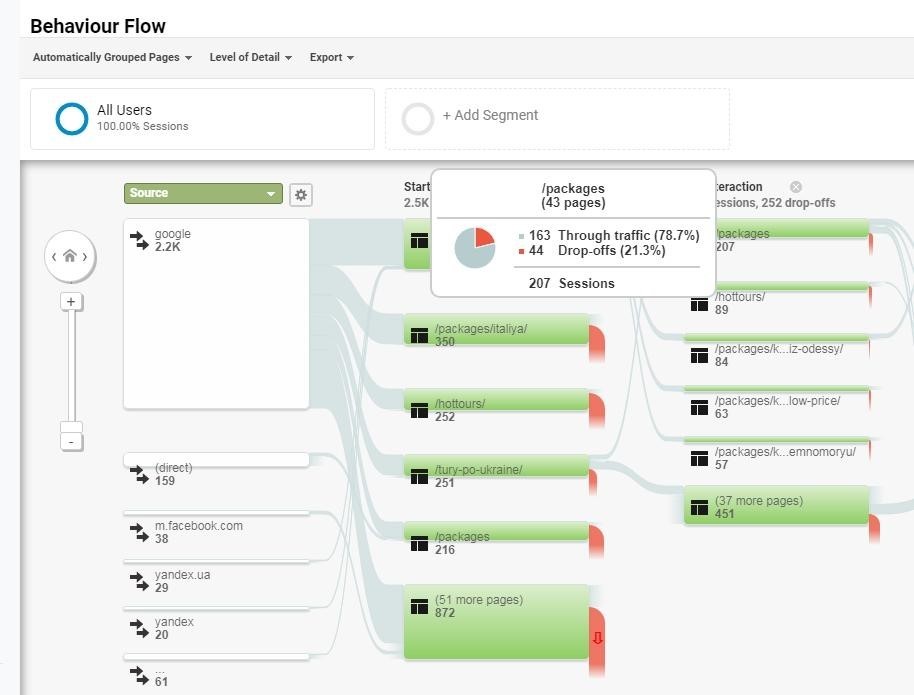
After moving the cursor over the desired page on the website, a chart will be displayed showing the ratio of the through traffic and the drop-offs from the resource:
through traffic and drop-offs in Google Analytics
Analysis of the behavior flow allows you to understand whether the users' real flow correspond to the ideas of how the flow to perform target actions (Customer Journey Map) should look like.

You can also view which materials are the most popular, and which, on the contrary, cause the most user drop-offs. Besides, using the report, you can get information on whether customers view additional goods or services before making a purchase.

Google Analytics Goal Flow and Analysis
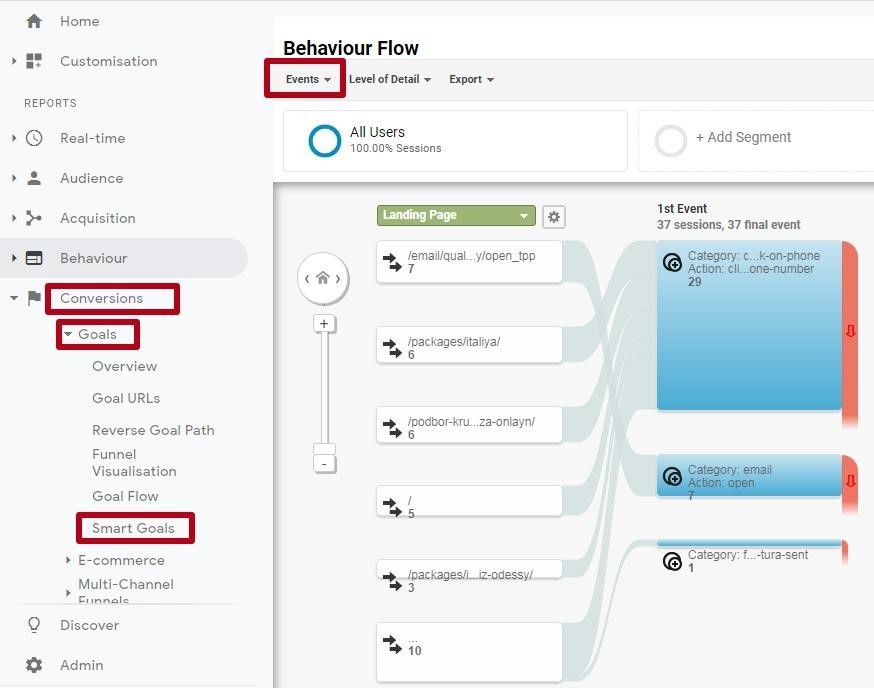
To view, go to "Conversions" - "Goals" - "Goal Flow":
goals map in Google Analytics
In order to use this report, you need to set goals in your account. There are four types of goals: loading a specific page, sessions with a specific time duration, the number of pages viewed, and a specific event. There is a limit for one presentation to a maximum of 20 goals.

You can also set the sequence of steps to get to the goal. After the setup, the report will display the users' directions to conversion, and by analyzing them, you can find out whether there are frequent drop-offs or loops on any pages of the website.

If there is a significant traffic leak on a certain website, it is desirable to simplify the sequence of actions for the conversion and remove unnecessary steps.

"User Flow" in Google Analytics and their Analysis

This report compares the traffic volume from various sources and marketing channels, identifying patterns of user behavior on the resource. Here you can see how users interact with website content, analyze the effectiveness of pages and flow.

In order to view the data, you need to go to the "Reports" - "Audiences" - "Users Flow":
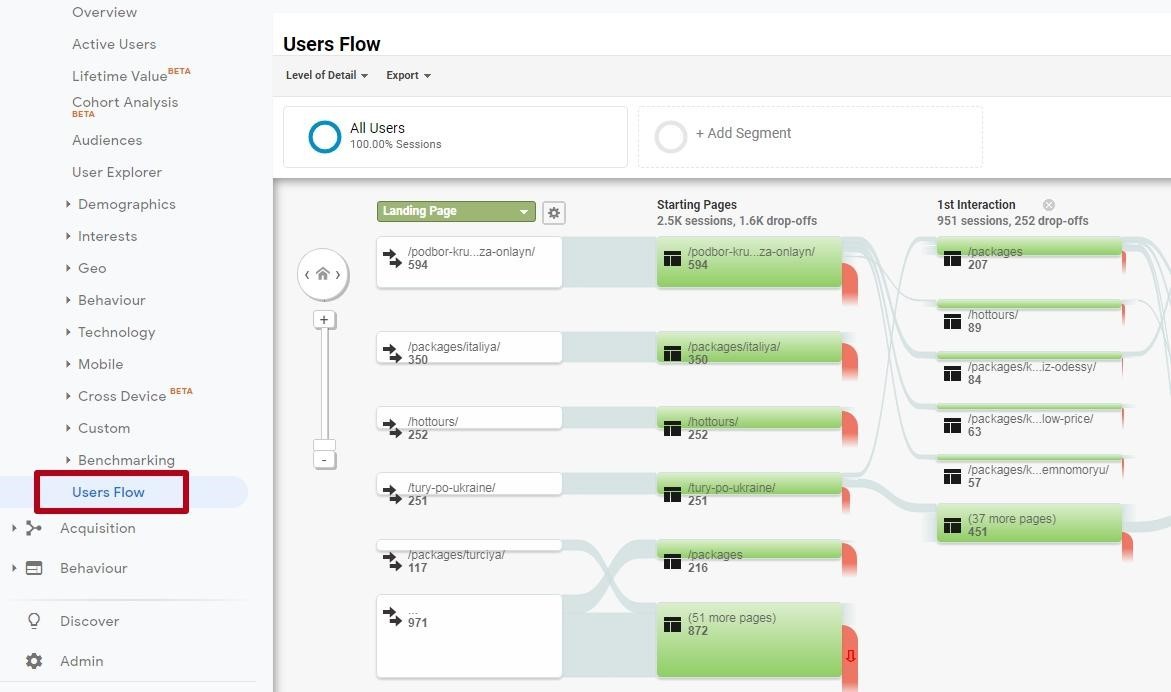
user flow in Google Analytics
This report is similar to the "Behavior Flow", but here you can only view pages without information about events and the use of content groups.

The report displays three steps by default, but you can increase their number to 12. To do this, simply click "+ Step":
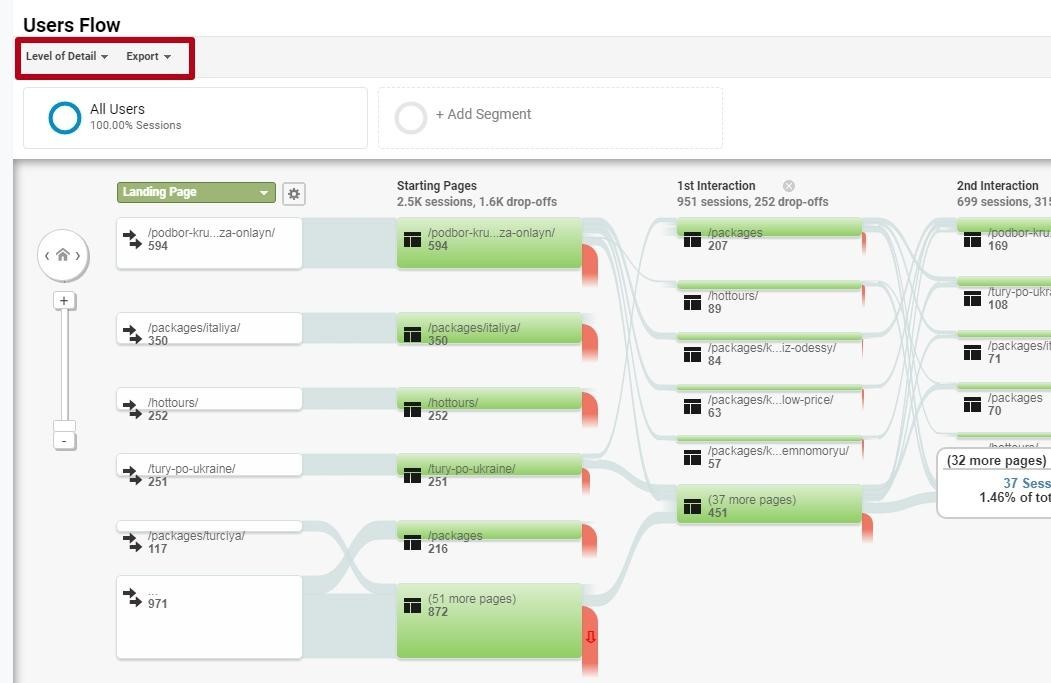
Users interaction with the website
To analyze the effectiveness of users' interaction with the project, you can create a hypothetical ideal path to conversion, for instance: "Product page in the online store" - "Shopping cart" - "Order page".

However, if in reality you see this path: "Homepage" - "Website search" - "Search results page" - "Drop from the resource", this indicates that users didn't find the materials or goods they were looking for on the website.

In this case, you need to analyze the user search on the website, improve navigation and, possibly, expand the variety of products.

User LocationTracking Plugins for Popular CMS
1
Plugin for WordPress Crazy Egg:
WordPress plugin for analyzing site visits using
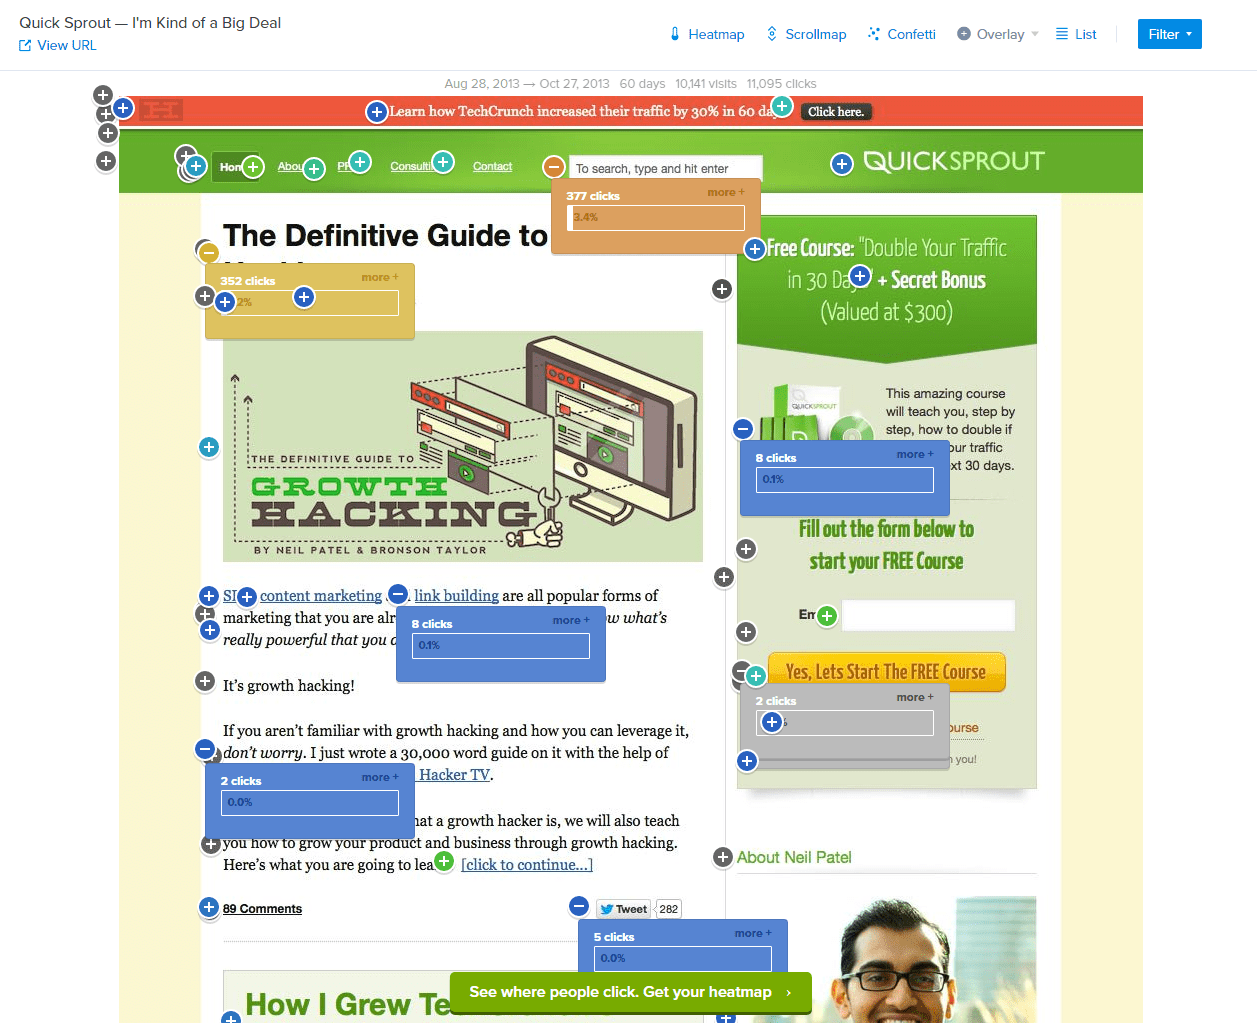
This is a WordPress plugin designed to analyze website visits using the Crazy Egg service. The tool allows you to view heat maps: user's clicks and scrolling on the website. It can perform audience segmenting and track conversions.
2
Module for OpenCart SEO Heat Map:
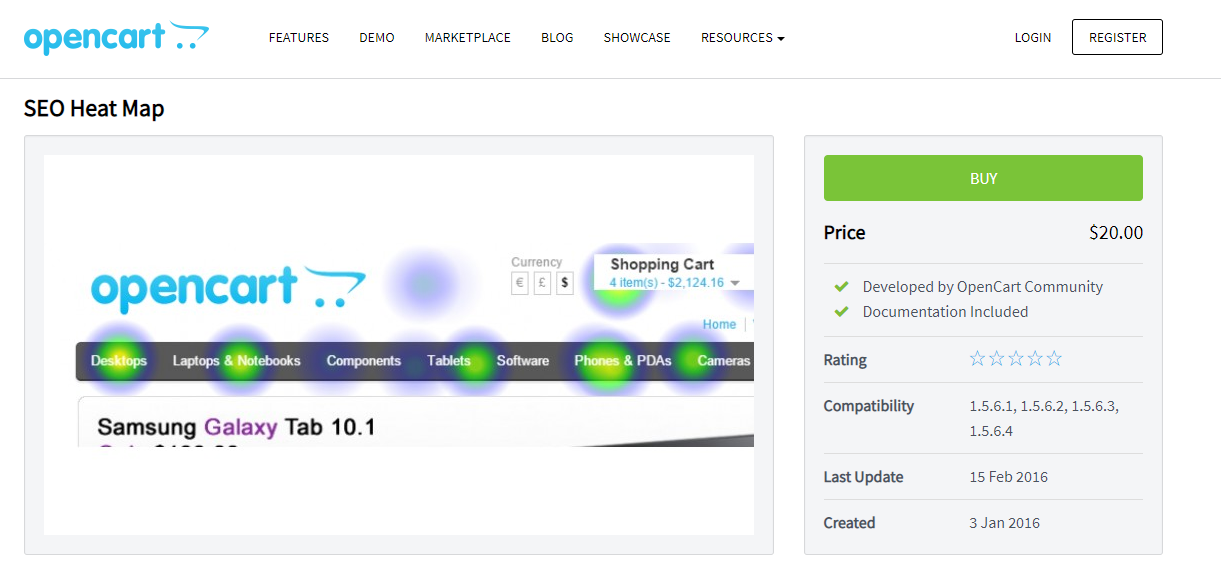
Heat map module for OpenCart
The plugin is designed to analyze the user's behavior and clicks in online stores using CMS OpenCart.
3
Module for Drupal Lucky Orange:
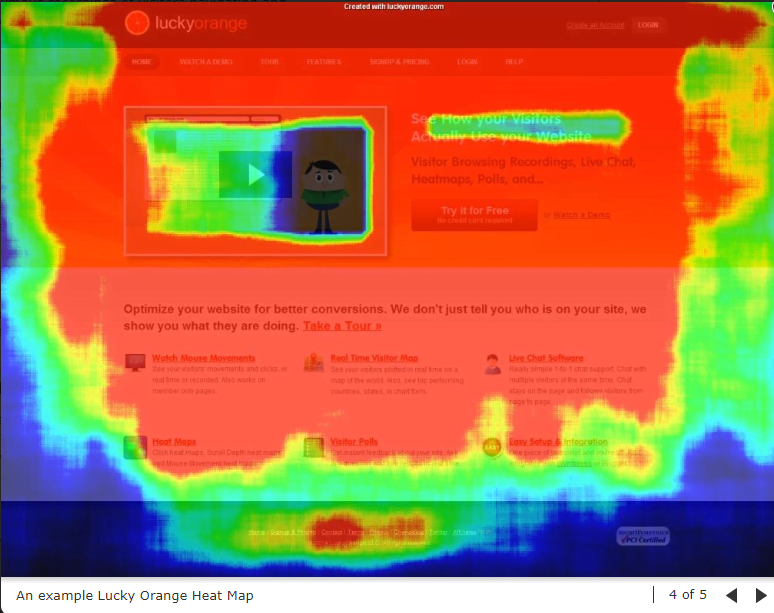
heat map module for Drupal
The module also has a feature to analyze the heatmaps of visits, allows you to track user actions in real time, and view video records.
4
Extension for Joomla JRealtime Analytics:
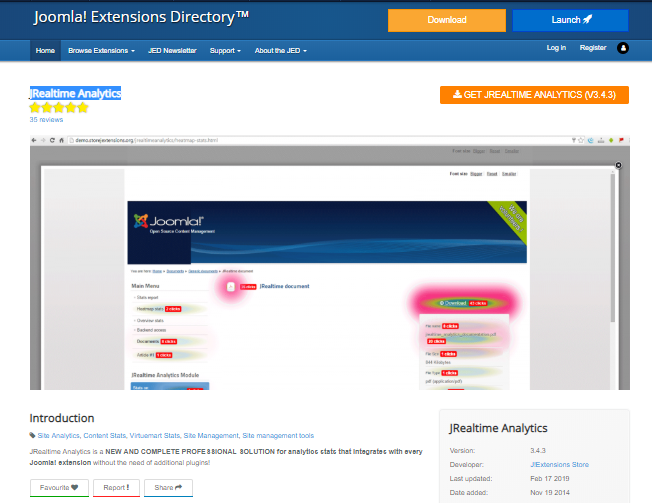
Heat map extension for Joomla
The service allows you to receive statistics of visits in real time, track all clicks and user navigation on the website.

Conclusion

Web analytics services and special plugins will help you to:

  • find out which user paths are the most popular, and how you can optimize steps to target actions in order to improve conversion; Web analytics services and special plugins will help you with this;
  • set most and least visited pages and sections;
  • see at which stages occurs the maximum traffic flow;
  • identify which interface design elements are perceived by visitors as links, without being classified as such;
  • check how often the website materials are read to the end;
  • get statistics of filling out forms on the website;
  • analyze the visitors' behavior of a certain segment, etc.

This article is a part of Serpstat's Checklist tool
Checklist at Serpstat" title = "How to analyze user behavior and location history on the website 16261788313076" />
Checklist is a ready-to-do list that helps to keep reporting of the work progress on a specific project. The tool contains templates with an extensive list of project development parameters where you can also add your own items and plans.
Try Checklist now

Speed up your search marketing growth with Serpstat!

Keyword and backlink opportunities, competitors' online strategy, daily rankings and SEO-related issues.

A pack of tools for reducing your time on SEO tasks.

Get free 7-day trial

Rate the article on a five-point scale

The article has already been rated by 0 people on average out of 5
Found an error? Select it and press Ctrl + Enter to tell us

Discover More SEO Tools

Tools for Keywords

Keywords Research Tools – uncover untapped potential in your niche

Serpstat Features

SERP SEO Tool – the ultimate solution for website optimization

Keyword Difficulty Tool

Stay ahead of the competition and dominate your niche with our keywords difficulty tool

Check Page for SEO

On-page SEO checker – identify technical issues, optimize and drive more traffic to your website

Share this article with your friends

Are you sure?

Introducing Serpstat

Find out about the main features of the service in a convenient way for you!

Please send a request, and our specialist will offer you education options: a personal demonstration, a trial period, or materials for self-study and increasing expertise — everything for a comfortable start to work with Serpstat.

Name

Email

Phone

We are glad of your comment
I agree to Serpstat`s Privacy Policy.

Thank you, we have saved your new mailing settings.

Report a bug

Cancel
Open support chat
mail pocket flipboard Messenger telegramm