How to Check and Analyze Website Traffic Statistics: Beginner's Guide
What Is Website Traffic Statistics?
Why Do I Need to Analyze Website Traffic Statistics?
Key Indicators of Website Traffic Statistics
How to See How Much Traffic a Website Gets
Main Indicators of Traffic Analysis
Statistic Comparsion with the Previous Period
Competitor Traffic Analysis
Conclusion
All online store or eCommerce website owners want their web resources to have a high conversion rate. Nevertheless, not many of them spend time checking and analyzing their website traffic statistics.
This article will help you understand how to view and estimate the traffic to your website and the pages of your competitors.
What Is Website Traffic Statistics?
Using website traffic statistics, you can get information about:
- Total number of website's visitors.
- All actions visitors take on the website.
- Your website's performance.
- Results of website optimization and promotion.
Correct estimation and analysis of such data will help you find problems in your promotion strategy and make it more effective. Regardless of a web resource type – an online store or a simple landing page – you have to continuously analyze your website's traffic.
Why Do I Need to Analyze Website Traffic Statistics?
Website traffic analysis can provide answers to the following questions:
1) What percentage of the target audience visits your site (out of the total traffic)?
2) What traffic source generates the highest number of target visitors and conversions?
3) How much time do users spend on the site and how many pages they view?
4) What should we do next (what to fix) to achieve the set goals?
Once you start analyzing traffic statistics, you'll better understand your visitors and their behavioral patterns.
Key Indicators of Website Traffic Statistics
1) Sessions. The number of website visits for a selected period. One session is one visit to the website completed by any user. The session is over if the user leaves the website or remains inactive for over 30 minutes. Therefore, the more sessions you have, the more effective your promotion strategy is.
2) Pages / Session. This indicator reflects the visit depth of a website. You can learn how many pages users view during one session. A high number of pages means that your web resource is interesting, useful, and convenient.
3) Average Session Duration. The duration of one session calculated as the average number. The longer users stay on your website, the better search ranking it has.
4) Users. The number of unique users that have visited the website for a selected period of time. Don't confuse the number of sessions and the number of users. Sessions show how many times all users have browsed your website. As a result, the number of users is always lower than the number of sessions.
5) Bounce rate. The percentage of users who leave the website within less than 15 seconds after visiting it. High bounce rates show that the web resource doesn't satisfy the needs of visitors and they have landed there accidentally. To reduce it, consider adding gamified widgets or personalized exit-intent pop-ups.
6) Channels. These are the sources of user traffic. There are nine types of such channels that will be described in detail below.
7) Devices. The metrics that segment users by device type (PC, tablet, smartphone).
8) Average position. The indicator that reflects the position of the website in search results.
9) CTR. The ratio of impressions to the number of clicks on your page in search results. The better CTR you have, the more effective your website promotion strategy is.
10) Clicks. This data shows how visitors interact with different elements on your website pages. Analyze the page clicks to see which elements are ignored and fix them to improve your website usability.
11) Scrollmap. This information allows analyzing the scroll depth on your website. Thus, you can make sure that the most important information is the most noticeable.
It's not an extensive list of all indicators that measure user traffic. After you start analyzing a website, you can select and track additional metrics.
How to See How Much Traffic a Website Gets
To analyze the mentioned website traffic indicators, we will use the following services:
1) Google Analytics is a must-have for any web resource. This is a free service that has almost everything you need to promote and optimize a website. If for any reason you haven't installed it yet, here is a link with a manual from the Google Analytics team.
2) Search Console is a free service provided by Google that allows analyzing website SEO and performance. Follow this link for a detailed installation manual.
3) Plerdy is a platform that helps to improve website UX and grow conversions. It includes several tools such as a click heatmap, PopUp forms, and SEO alerts. With over 80 features and capabilities for online marketers, Plerdy script takes less than 30 seconds to install. Follow the link, to learn how to install Plerdy.
Let's review each of the indicators based on the example of an online store of travel equipment. For a more detailed and in-depth analysis, we have selected the period from April 1 to April 30. Therefore, all the provided data is related to this period.
Main Indicators of Traffic Analysis
Sessions, Users, Pages / Session, Avg. Session Duration, Bounce Rate
To check these indicators, sign in to your Google Analytics account and go to Audience > Overview.
Here are Sessions, Users, Pages/Session, Avg. Session Duration, and Bounce Rate for our online store in April.
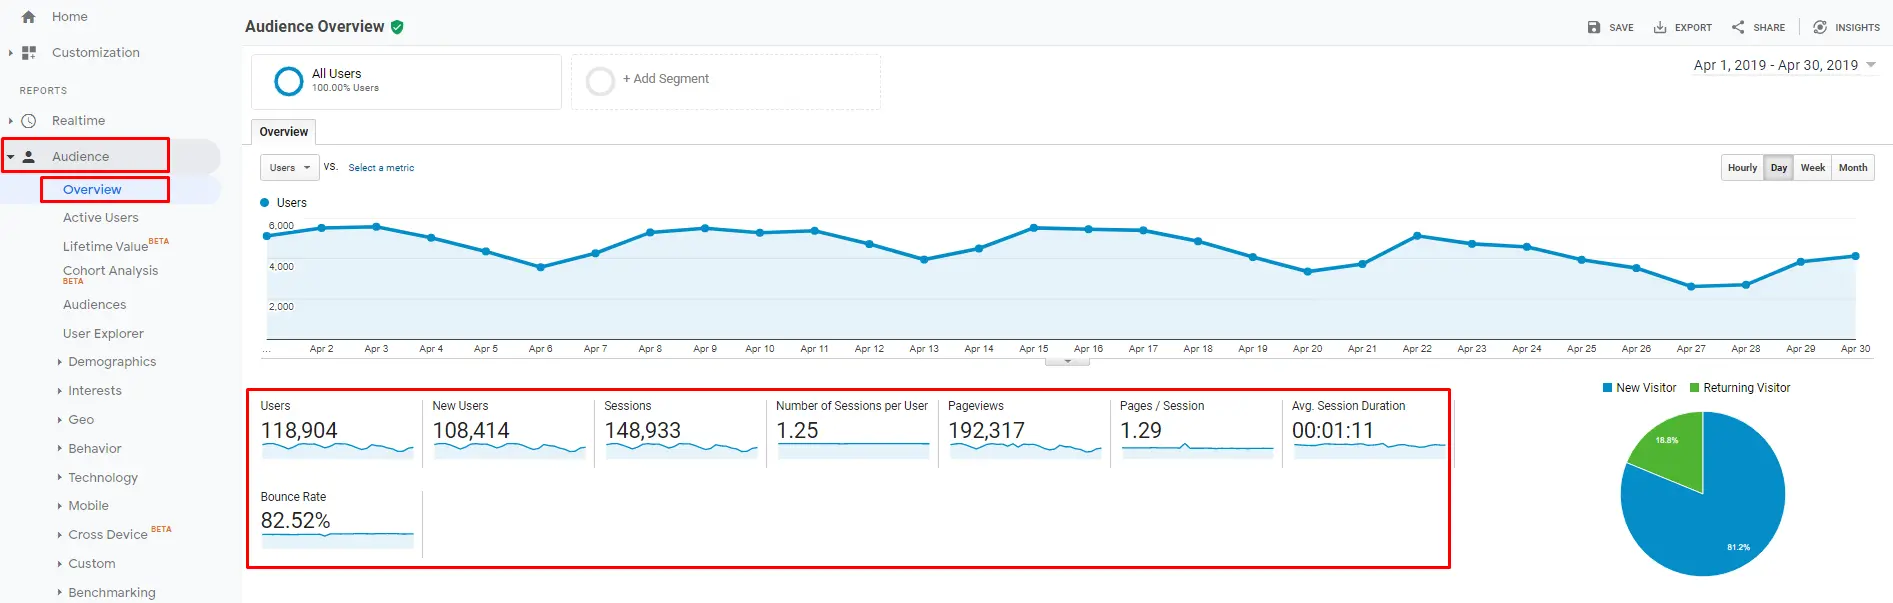
Based on the April data from the screenshot, we can learn that:
1) The website is popular with 148,933 user sessions per month.
2) The number of sessions exceeds the number of users by 20%. This means that 20% of users may have visited the online store twice (or even more).
3) The average number of pages per session is 1.29. We can assume that after visiting a product page, users proceed to the payment page.
4) The bounce rate is quite high for this type of online store (82.52%). This means that only 17.48% of visitors stay on the website for more than 15 seconds.
5) Session duration is also small – only 1 minute 11 seconds.
This information is already enough to draw the following conclusions:
1)The SEO strategy developed for website promotion is successful since 20% of users return to view the content.
2)The key problem is that in most cases, users leave the resource very quickly. This may mean that its semantic kernel isn't properly distributed among the pages.
Let's move on. The next website traffic indicator we'll analyze is types of traffic channels.
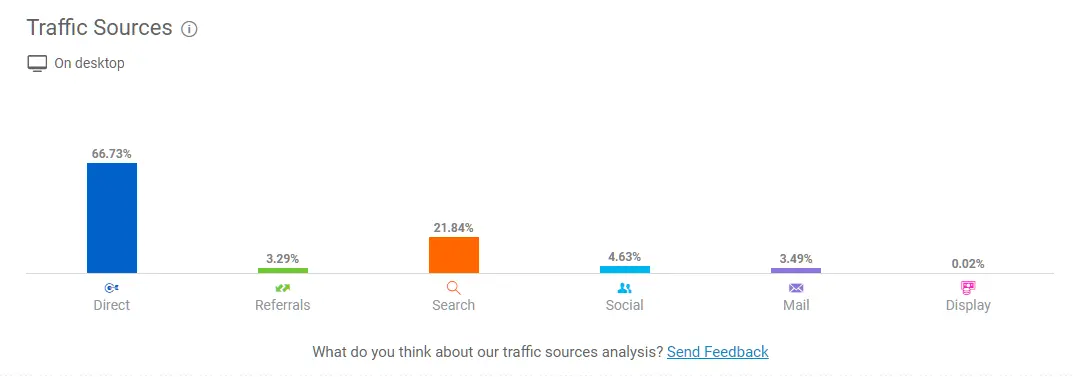
Traffic Channels
To analyze all traffic channels, open Google Analytics, go to the Acquisition section > All Traffic > Channels.
Here is the breakdown of traffic channels for the analyzed website.
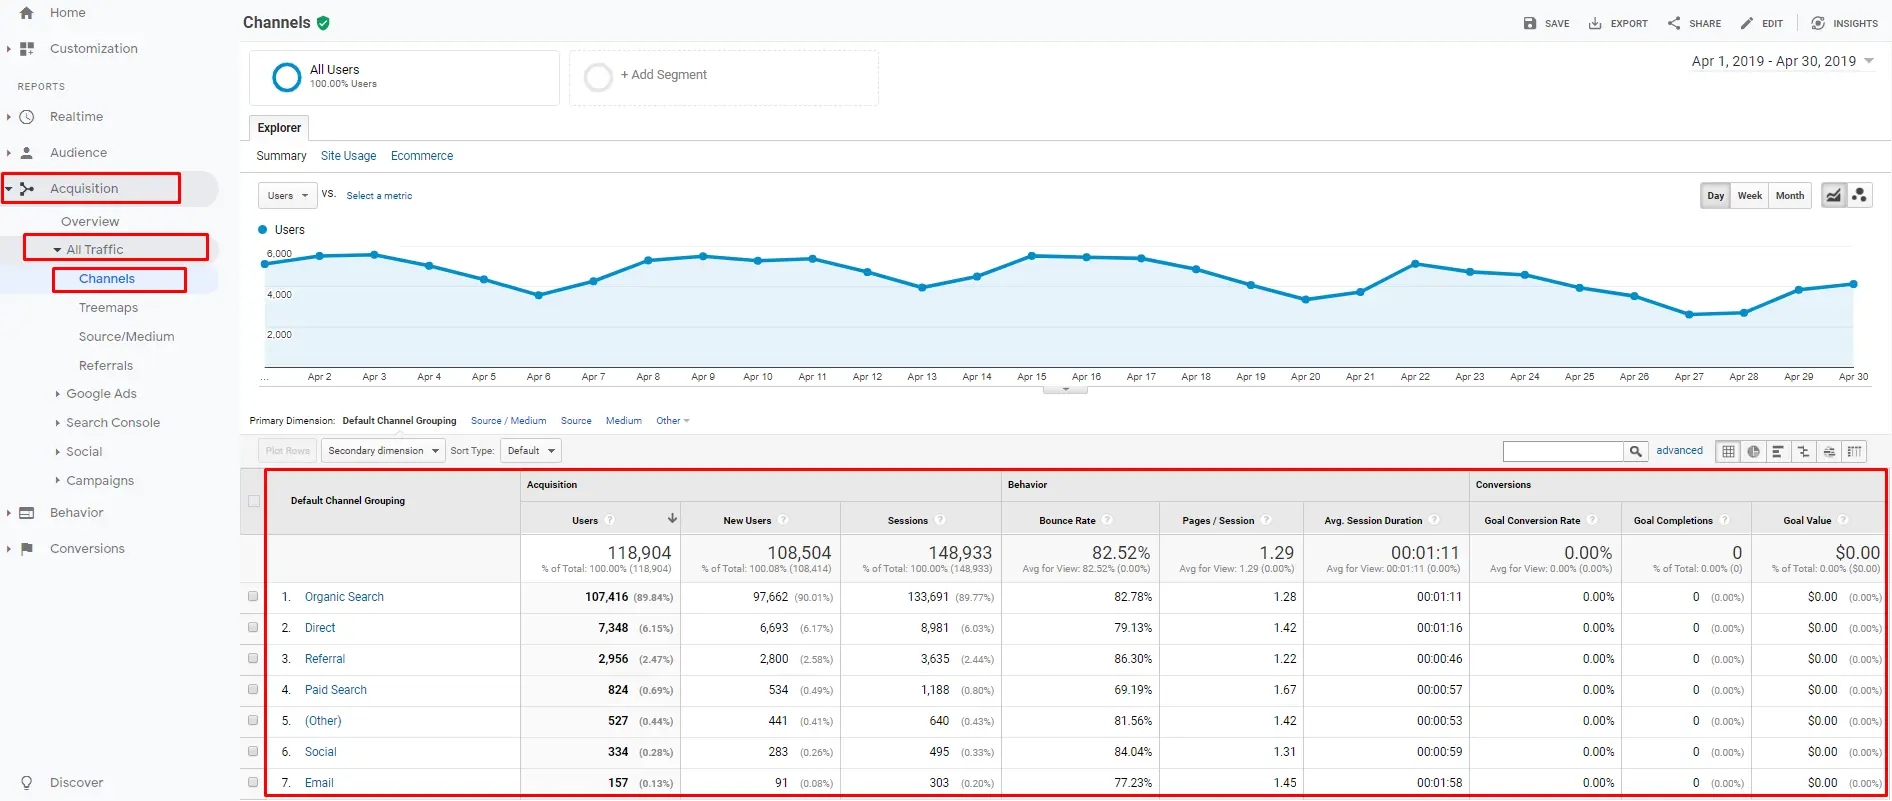
This store gets traffic from eight sources:
1)Organic: Search engine results' pages;
2) Direct: Purposeful and direct visits to the website;
3) Referrals: Transitions to the website through the links on third-party resources;
4) Paid Search: Transitions through ads in Google;
5) Social: Transitions through social media;
6) Email: Transitions through corporate email newsletters;
7) Display: Transitions through banner ads set in Google Ads;
8) Other: Traffic that Google Analytics could not recognize;
As you can see, our online store receives the main share of visitors from search results. It means that its owners have taken care of its search engine optimization.
Apart from the list of mail traffic sources, this screenshot also includes other indicators for every source. You can compare and analyze these rates to understand which traffic source is the most effective and which channel you may even ignore.
In this case, the organic search yields the best results, whereas email is unproductive.
Devices
This indicator is critical for quality website traffic analysis. You have to know what devices your visitors use to make the resource convenient and clear.
Here is the statistics by device type for the online store of travel equipment:
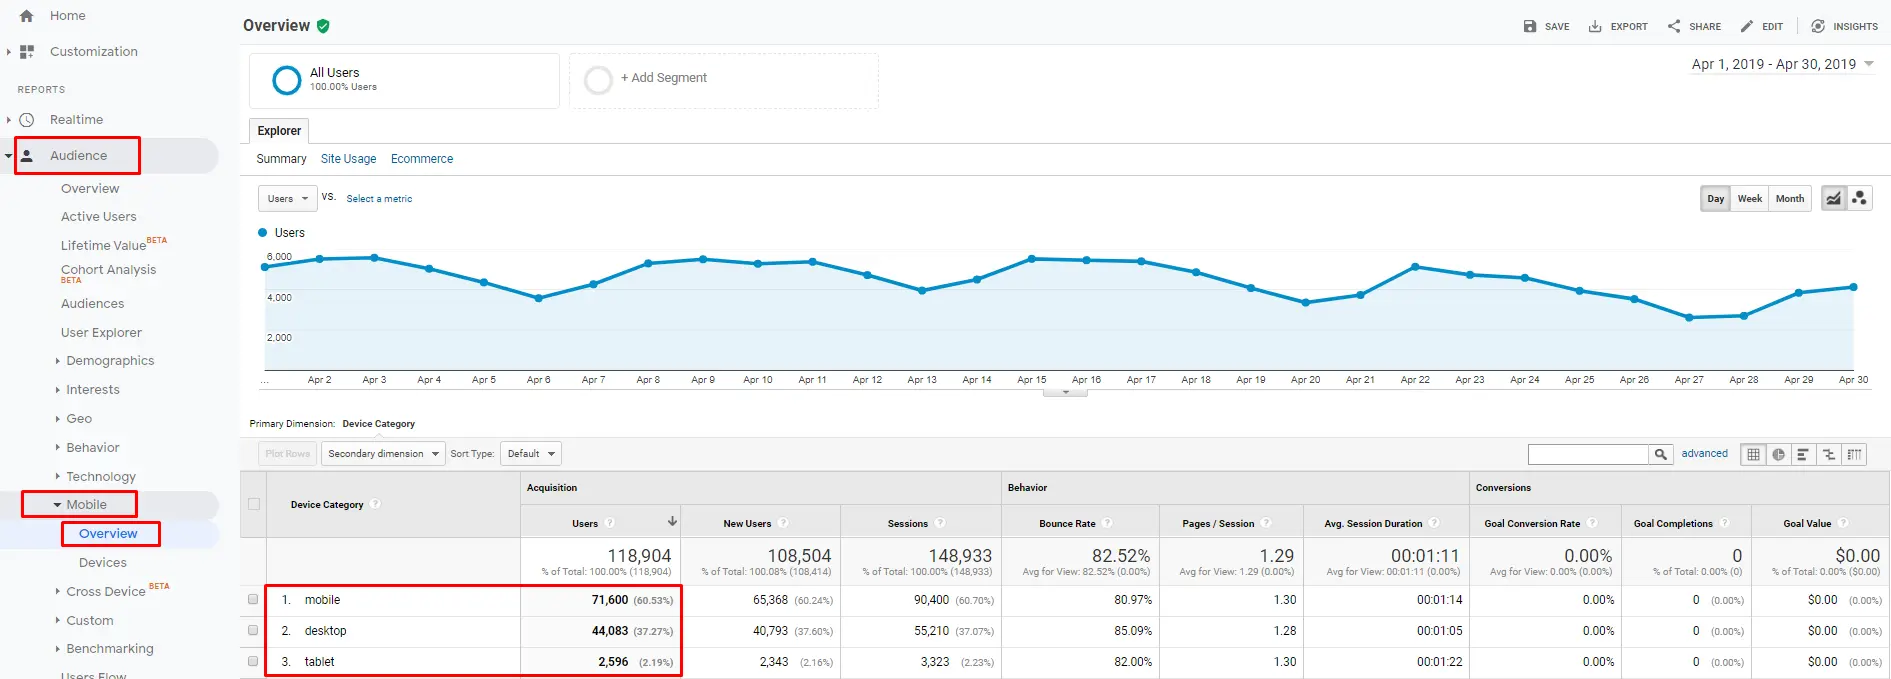
The majority of visitors browse the online store on mobile devices. Therefore, if your website isn't optimized for smartphones, you lose a striking number of users.
To avoid losing these users, make sure all your interactive elements — such as forms, pop-ups, or surveys — are fully mobile-optimized. Tools like Claspo offer mobile-friendly, responsive widgets that automatically adapt to screen size and behavior, helping you convert mobile visitors more effectively.
Average Position
Such analysis is necessary if you perform or plan to perform search engine optimization of your website. This type of data reflects the actual ranking in search engines.
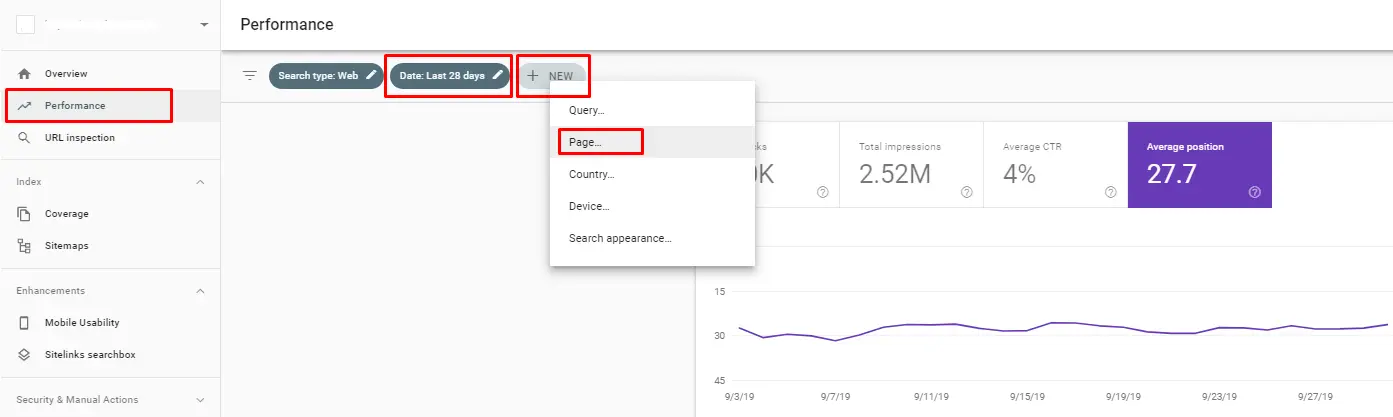
To view the website position for keywords, go to Google Search Console > Performance tab.
In April, the average position of the analyzed online store was 27.7.
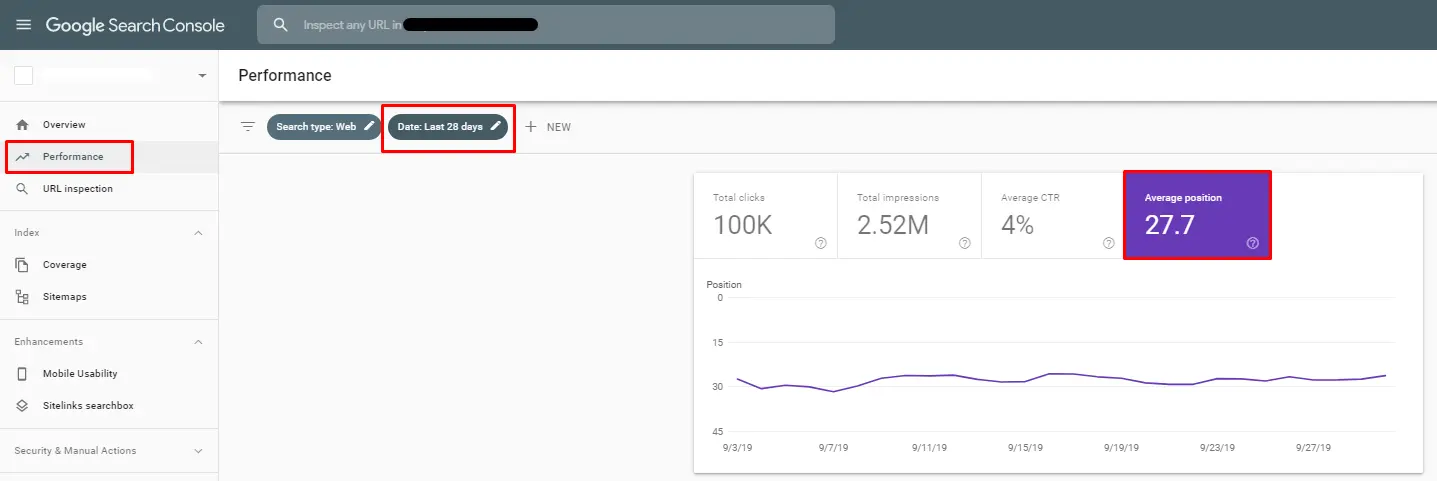
Frankly speaking, this isn't the best search ranking. Nevertheless, don't get depressed. This indicator is just an average rate for all keywords on all website pages. Since you can never be in the top for all search requests, it's better to regularly check your ranking by page, using site ranking tools . Such numbers will reflect the real situation on your website.
To view statistics for a separate page, click + NEW > Page:
CTR
CTR (Click-through rate) is an important indicator that shows website performance. You should analyze it both for the entire website and for every page or category.
Our online store of travel equipment had an average 4% CTR during the analyzed period.
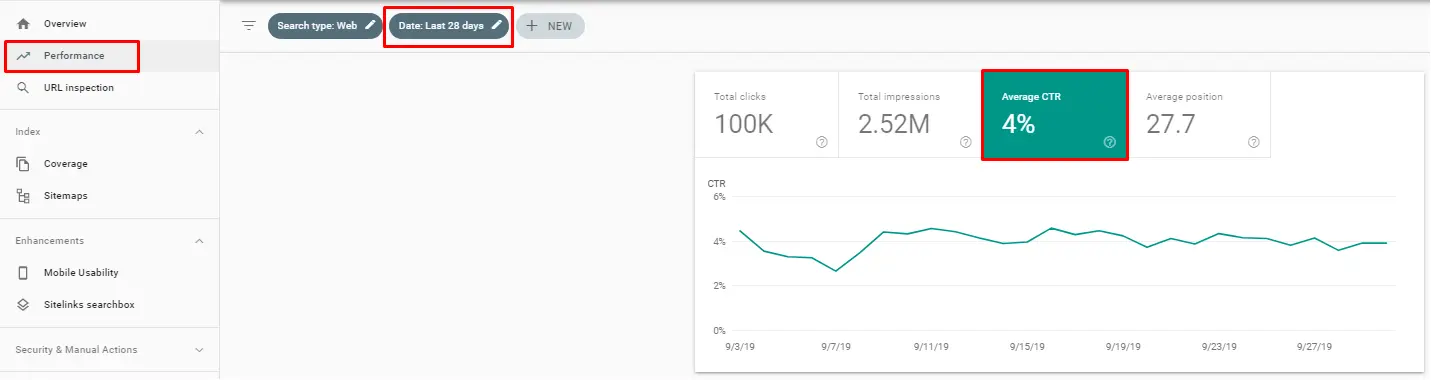
There is no fixed or ideal value for a CTR. You must regularly take measures to increase it. To achieve a better result, try to improve the Title and Description of pages and continuously expand your semantic core.
Clicks
For this website analysis, you should use an analytics tool offered by Plerdy. It's easy to install and provides valuable information on website performance. To find out how many clicks users make on website elements, complete the following steps:
- Open a page you want to analyze.
- Press Ctrl + Alt + H on the keyboard. You will see a window asking for your login and password (you have entered this information during the registration).
- Once you authorize, you will see a dashboard on the selected page. Choose a period you plan to analyze and turn on a click map.
- The page will show the number of clicks on every element.
Based on this information, you can understand what to improve and which elements it's better to eliminate.
Scrollmap
Apart from click analysis, Plerdy also records the scrolling patterns on your website. To analyze the scroll depth of pages, you have to take the following steps:
Go to the page you want to analyze.
Press Ctrl + Alt + H to open the Plerdy dashboard.
Select the period you plan to analyze and turn on the scroll map.
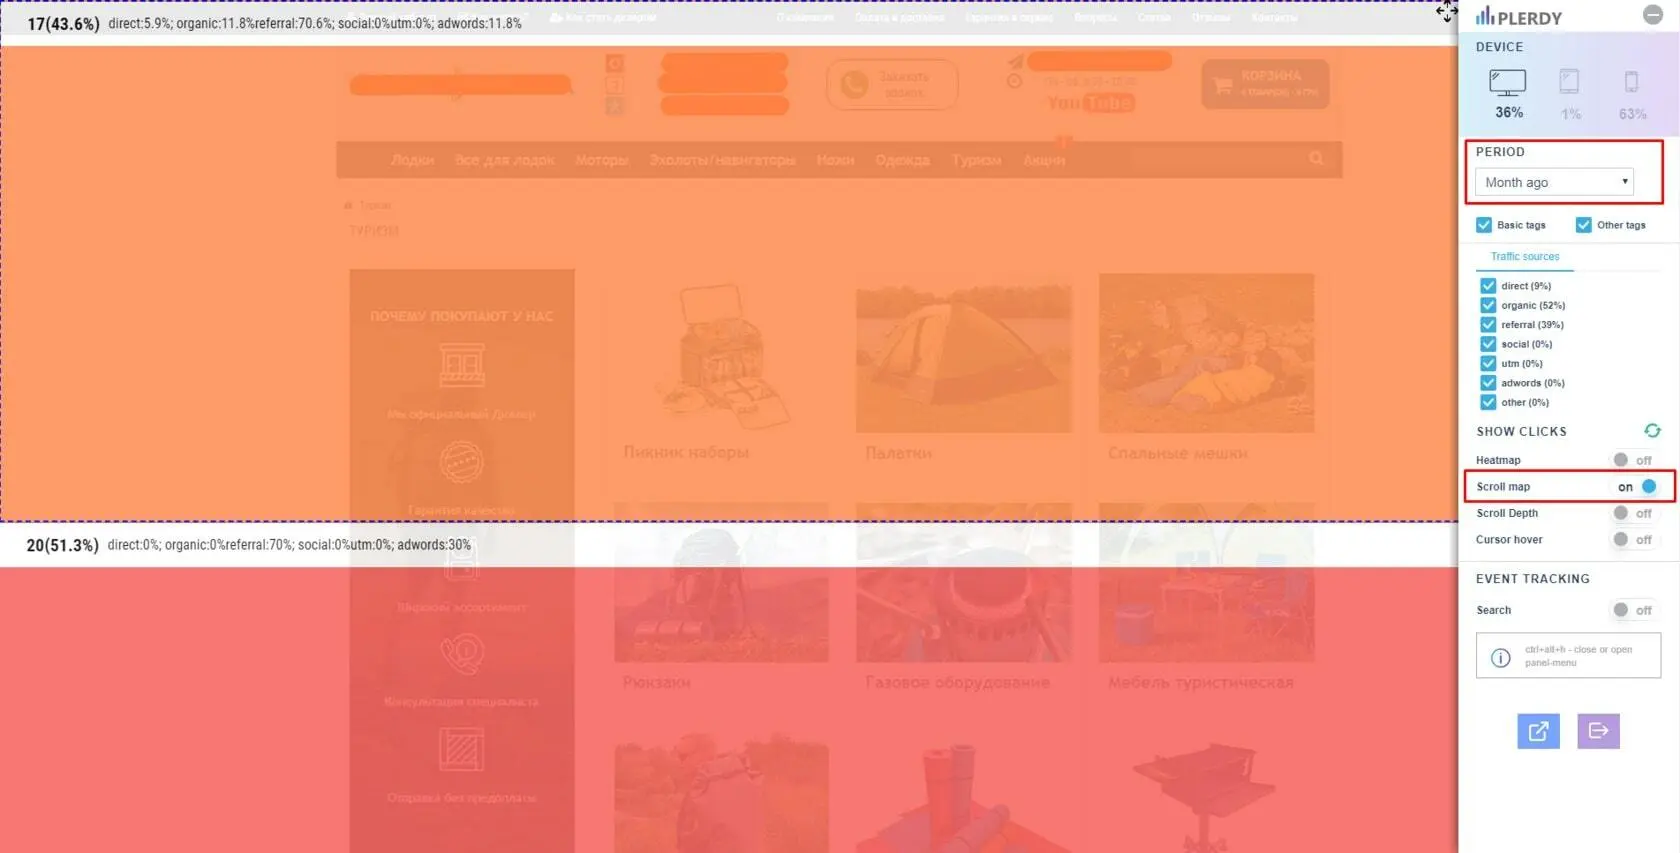
On the page, you will see a percentage of users who have scrolled to a certain point. It will be divided into several sections to show the scroll depth of each.Thanks to this, you can optimize the length of website pages and add information in the most eye-catching places.
Statistic Comparsion with the Previous Period
Don't forget that website performance indicators continuously change and depend on various factors. Therefore, to get a clearer picture, make sure to conduct a Before/After comparison.
To perform such an analysis, you will need to use Google Analytics and the following settings. Select dates and compare them with the previous period. Note that the chosen two months must have an equal number of days and start/end with the same day. For our analysis, we selected 30 days. The first day is Monday, and the last one is Tuesday.
The analysis shows the following results:
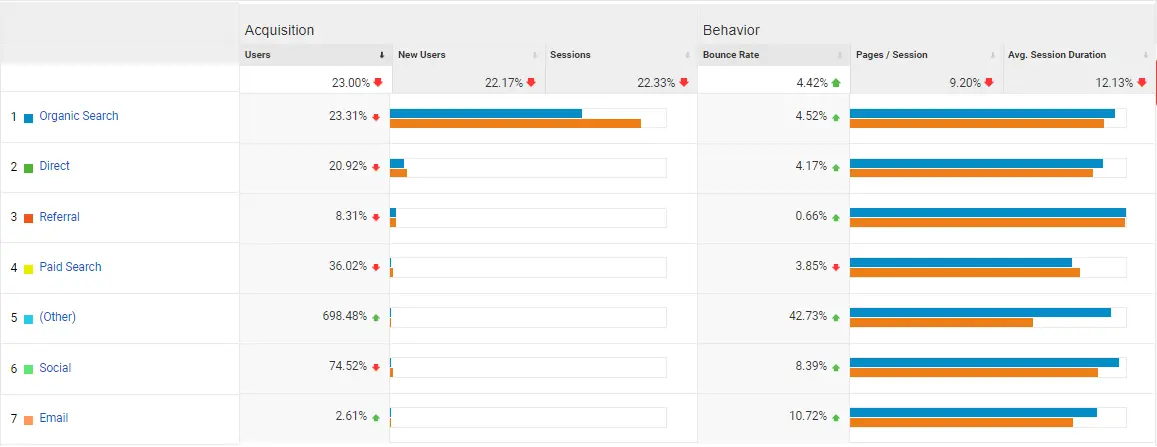
The screenshot clearly shows that the measures taken in April weren't effective and even counterproductive. You can rely on such data to adjust or change your website development strategy.
To improve the current approach to website promotion or implement a new one, you should also know your competitors. Don't forget about regularly monitoring them and comparing their web traffic with yours.
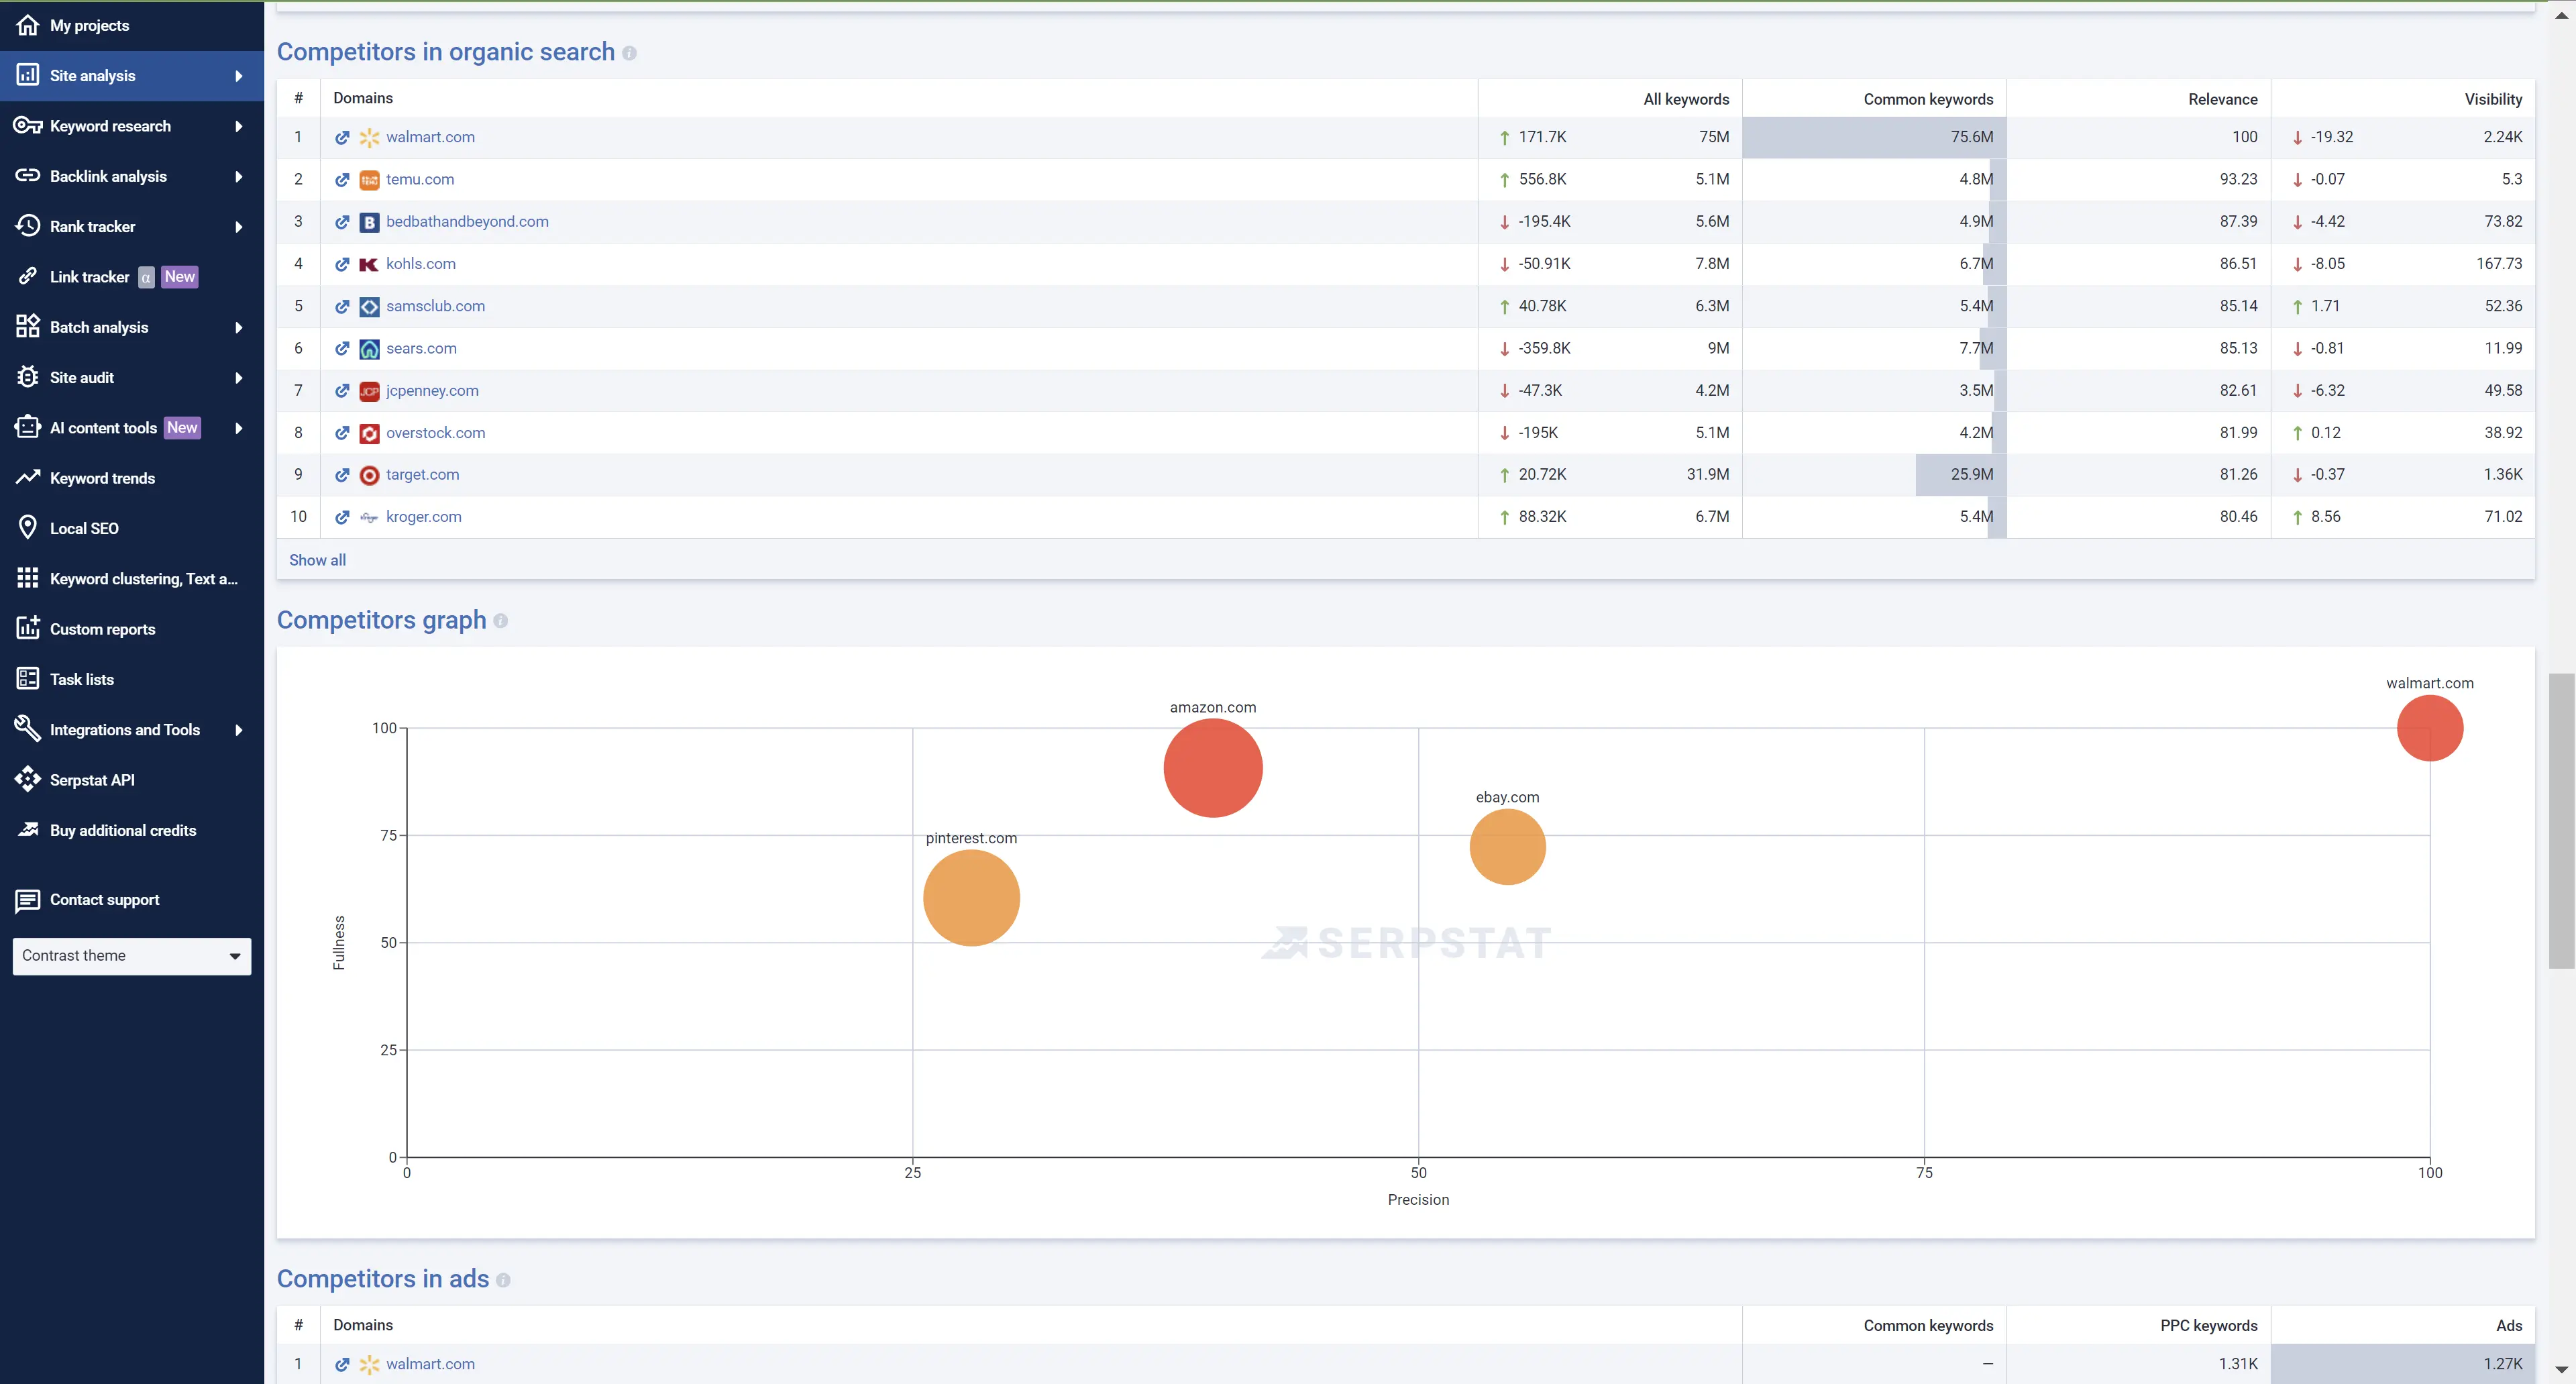
Competitor Traffic Analysis
To see how competitors run their business online and what methods they use, it's necessary to conduct a detailed analysis of their traffic statistics.
Plan for collecting information about competitor websites:
- Find your key online competitors.
- Select from 3 to 6 main competitors.
- Estimate website traffic of every competitor.
Find Your Key Online Competitors
If you feel like you can already answer this question, most likely, you mislead yourself. Your offline competitors aren't always the ones you compete with online.
How to understand who you are competing with on the web? Go to Google and search various keywords related to your business one by one. This will show you the general picture of the websites that comprise your business niche.
Still, this approach is quite time- and effort-consuming. Therefore, you can try special online services that can fully automate the search and analysis of competitors, such as Serpstat.
Choose several competitors that seem to be the most relevant. It's not recommended to include too many web resources in the analysis. The thing is that each of them may use a different approach and still get top results. If you are a newbie, the more competitors you analyze, the more likely you are to get confused and choose the wrong method.
Analyze Website Traffic of Every Competitor
There are several ways to collect and analyze the data on competitor traffic:
1) Website Ads page. Such pages are often available on mass media websites. Nevertheless, other resources sometimes also publish their statistics. Yet you should remember that such information may be outdated or inaccurate.
2) Request the statistics directly from a website owner. You can just address the company and ask them about a report on its website traffic. It's worth noting that this method may be effective if you contact a news website or want to become a partner or sponsor.
3) Use services. This approach we will discuss in more detail.
For checking and analyzing website traffic statistics of your competitors you can use the following services:
- Serpstat.
- SimilarWeb.
- Ahrefs.
Serpstat is a multifunctional service you can use to learn more about your competitors. It's an excellent solution for in-depth analysis. With Serpstat, you can view which keywords another website uses for promotion, contextual ads, our 100% accurate keyword rank tracking platform will help you check the position of a website.
SimilarWeb is an online service for statistical analysis of any website. You only have to take several steps:
- Open SimilarWeb.
- Enter the URL of a competitor in the corresponding field.
- Analyze the results.
Apart from the total traffic of the analyzed website, this service also shows the sources of traffic.
You have to take into account that the information in this service isn't 100% accurate. Usually, the provided numbers exceed the real rates by 2-3 times.
Ahrefs is an online tool that can help you learn more about the link building (used to increase a linkmass) and content strategy of your competitors.
Perceive this data as a foundation that will help you develop an action plan for the future.
Conclusion
The page weight affects its loading speed. Slow loading speed means you lose customers who won't wait till the page is loaded and would prefer going to the competitors' websites.
The website loading speed can be tested in Serpstat, and special online services such as Sitechecker helps determine the page size.
Use GZIP and CDN to optimize the page size, and also activate browser caching.
Additional ways to reduce page size are the following: removing unnecessary code components and fonts, compressing and caching images, and others.
FAQ
How to check website traffic?
There are plenty of tools that allow you to check how much traffic your website gets: 1. Google Analytics 2. Google Search Console 3. Serpstat 4. Semrush 5. SE Ranking 6. WebCEO 7. Sitechecker Pro 8. Alexa 9. SimilarWeb 10. Ubersuggest 11. Ahrefs 12. Moz Pro, and many more.
Can I check website traffic for free?
Yes, you can check the traffic of your website or any other website, for free or via free trial by using services such as Serpstat, SimilarWeb, Sitechecker Pro, MonsterInsights, WebCEO, Google Search Console, Google Analytics, Alexa, SE Ranking, Semrush, Moz Pro, Ubersuggest, and others.
To stay up to date with all the news from the Serpstat blog, subscribe to our newsletter. Also, follow us on Twitter, LinkedIn or join our private Facebook group to get all the insights!
Check Website Traffic of Your Competitors
Get Your Free AccessSpeed up your search marketing growth with Serpstat!
Keyword and backlink opportunities, competitors' online strategy, daily rankings and SEO-related issues.
A pack of tools for reducing your time on SEO tasks.
Discover More SEO Tools
Backlink Cheсker
Backlinks checking for any site. Increase the power of your backlink profile
API for SEO
Search big data and get results using SEO API
Competitor Website Analytics
Complete analysis of competitors' websites for SEO and PPC
Keyword Rank Checker
Google Keyword Rankings Checker - gain valuable insights into your website's search engine rankings
Recommended posts
Cases, life hacks, researches, and useful articles
Don’t you have time to follow the news? No worries! Our editor will choose articles that will definitely help you with your work. Join our cozy community :)
By clicking the button, you agree to our privacy policy.