Serpstat updates February 24, 2022  |  14252   54   |  10 min read  – Read later

How To Visualize Serpstat Reports Using Google Data Studio Connector

How To Visualize Serpstat Reports Using Google Data Studio Connector
Наталья
Vera Zhukova
Customer Success Manager at Serpstat
Those who work with data know that good visual part represents careful analysis. In particular, this rule applies to SEOs and online marketers who spend hours creating and reviewing reports for themselves and their clients. Read this article and learn how to visualize SEO data in Google Data Studio quickly.
Serpstat Connector is now available, allowing you to access and visualize Serpstat API reports in the Data Studio!

What is Google Data Studio and what's the profit?

Google Data Studio is a tool for creating reports that collect and display data in real-time. The tool has various visualization options and allows you to quickly create easy-to-use dashboards. Interactive reports include charts, links, clickable images, and more customized to your needs. What are the advantages of this platform?
What are the benefits of the platform?
1
The use of the platform is completely free for all Google users.
2
Creating the reports doesn't take up so much time and doesn't require special knowledge or skills.
3
Reports can be tailored to your specific needs.
4
Data is automatically loaded from integrated sources and displayed in real time.
5
You can share Data Studio dashboards via the link, and it is very convenient for teamwork.
What do you need to display Serpstat data in Google Data Studio?
All you need is a Google Account to create reports. Several data sources are available for analysis and clarity, and if you want to analyze Serpstat data, you should apply the Serpstat connector. This tool allows you to access the Serpstat reports.
You can use this integration mechanism only if you have a Serpstat account.
Which Serpstat reports can you visualize with Data Studio?
Now there are two available Serpstat reports, which you can download in the Looker Studio: Domain History and Competitors. Depending on users needs, we'll extend the range of options in the future.

Looker Studio shows the following data:

  • Organic traffic and visibility: the amount of organic traffic and the visibility of the website, which is calculated based on the keywords for which the domain appears in search results.
  • Organic keywords: the list of keywords for which the website analyzes is displayed in the search engine results.
  • Paid keywords: the list of keywords for which the domain ranks in the paid search results.
  • Competitors: See the list of your competitors, visibility, traffic, and keywords dynamics and domain's visibility.

How do you visualize Serpstat reports using Looker Studio?

#1

Connect Serpstat with Looker Studio

Click on the button to connect Looker to Serpstat and set reports. You can authorize by connecting to your Google Account:
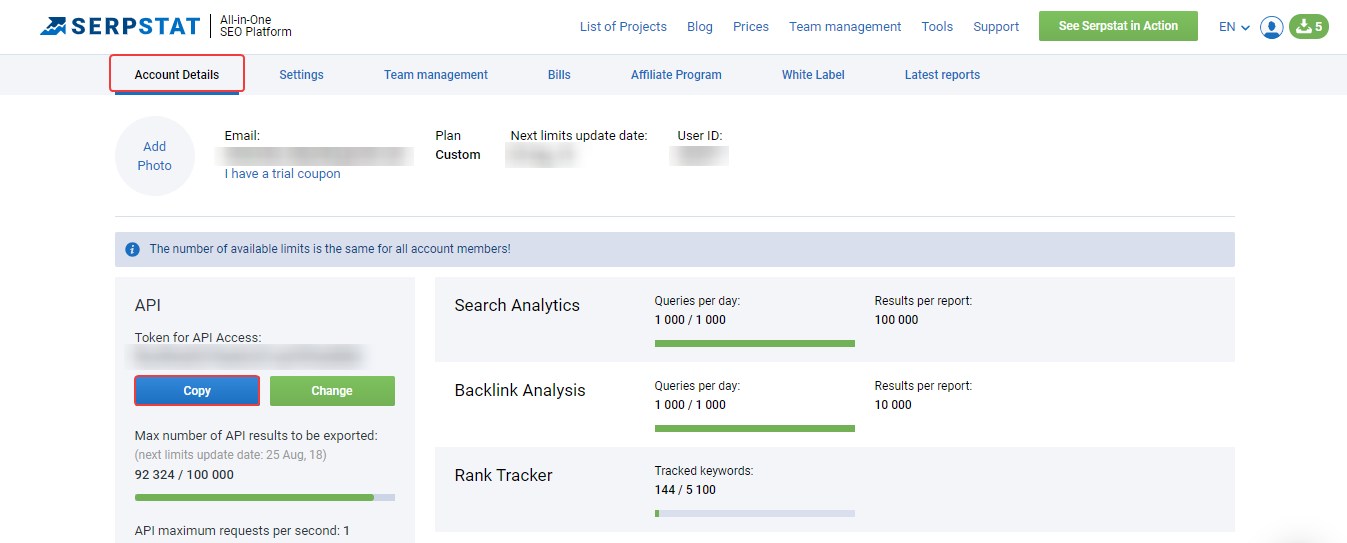
To integrate the data from Serpstat, you should enter your API token. You can find it in your profile:
How To Visualize Serpstat Reports Using Google Data Studio Connector 16261788247677
If the token is valid, your data will be connected to the Looker Studio. To try the analysis, you should do the following:

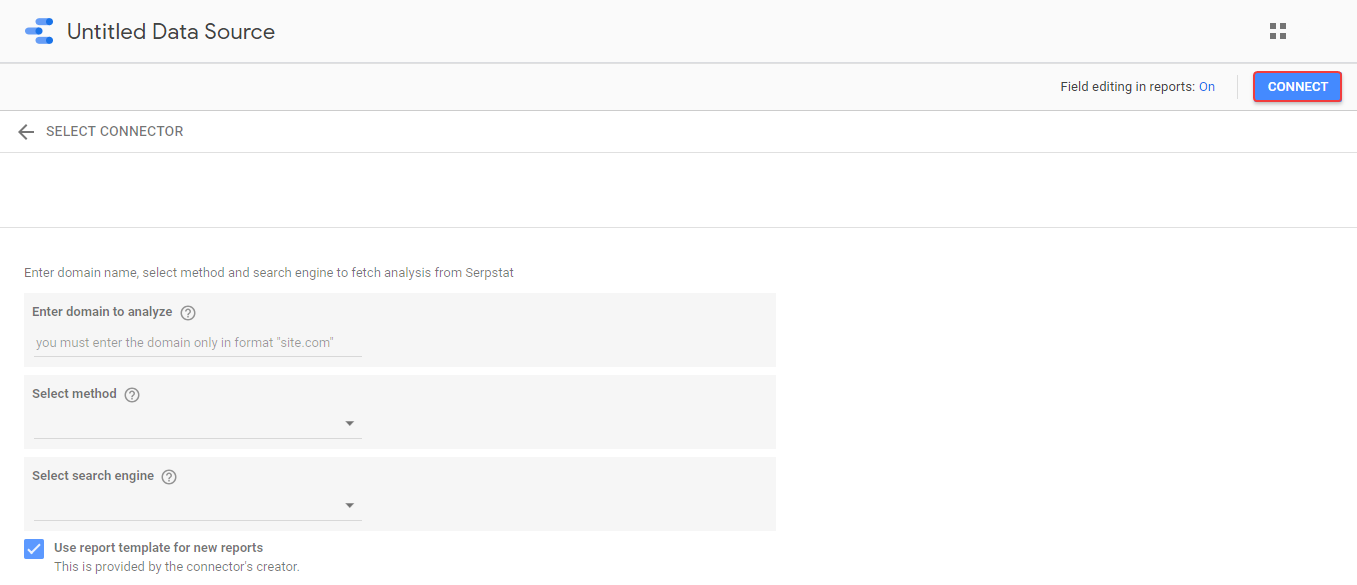
  • Enter a domain for the analysis in the form example.com.
  • Choose the method you want to use to collect the information. There are currently two reports available: Domain History and Competitors.
  • Set the search engine database from which the data will be displayed.
  • Click on the button Connect in the upper right corner.
How To Visualize Serpstat Reports Using Google Data Studio Connector 16261788247678
In the upper left corner you can rename the report.
#2

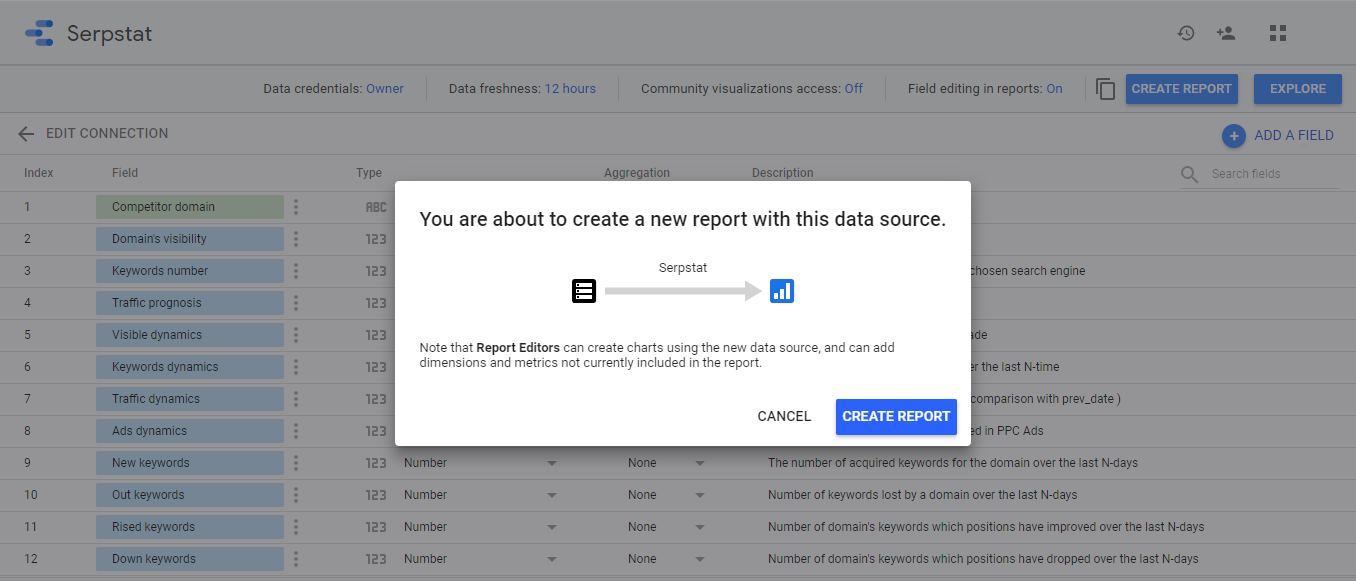
Create a new report

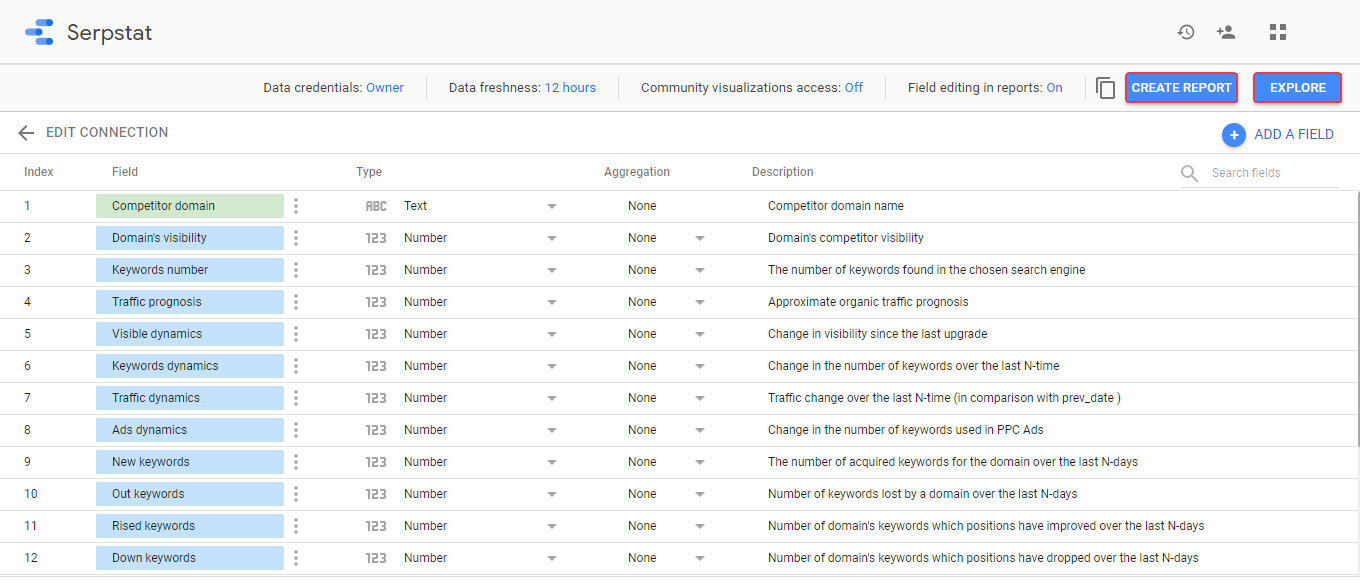
After setting up the data sources, you'll have a new window with 2 tabs: Create Report and Explore.
How To Visualize Serpstat Reports Using Google Data Studio Connector 16261788247679
You can view and adjust the data for visualization on the Explore tab. In the navigation menu on the right, you can select the parameter (it is convenient to select date for the History report, and domain name for Competitors) and indicators. On the Create Report tab you'll find a report template. This is an example of what your report might look like. It is formed by two reports: Domain History and Competitors.
How To Visualize Serpstat Reports Using Google Data Studio Connector 16261788247680
The Domain history report corresponds to the first three tabs:

  • Organic traffic and visibility
  • Organic keywords
  • Paid keywords.

The Competitors report corresponds to the competitors tab.
How To Visualize Serpstat Reports Using Google Data Studio Connector 16261788247681

How to set up reports

Depending on specified data sources, the template fills in the area that corresponds to the specific Serpstat report. If you don't want to visualize all the data offered, you can easily delete unnecessary tabs. The template introduced above is just an example and the user can set any report in any convenient way.

If you want to combine two reports in one to have all the information in one place, you have two ways:
Way #1
We create two separate History and Competitors reports.

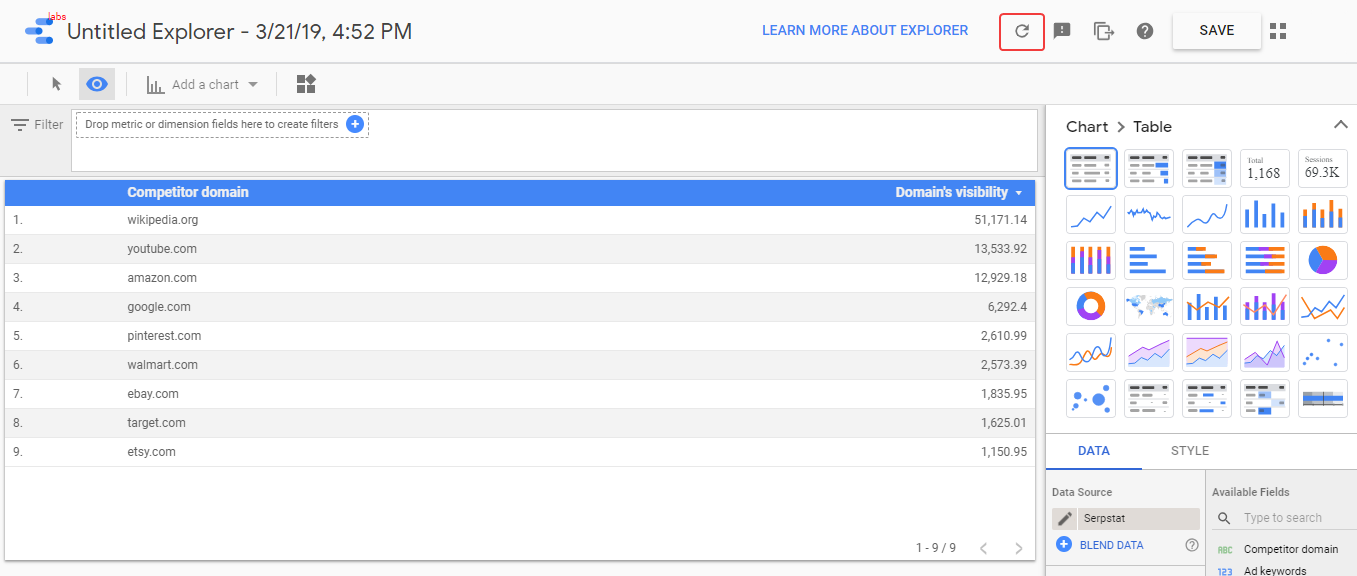
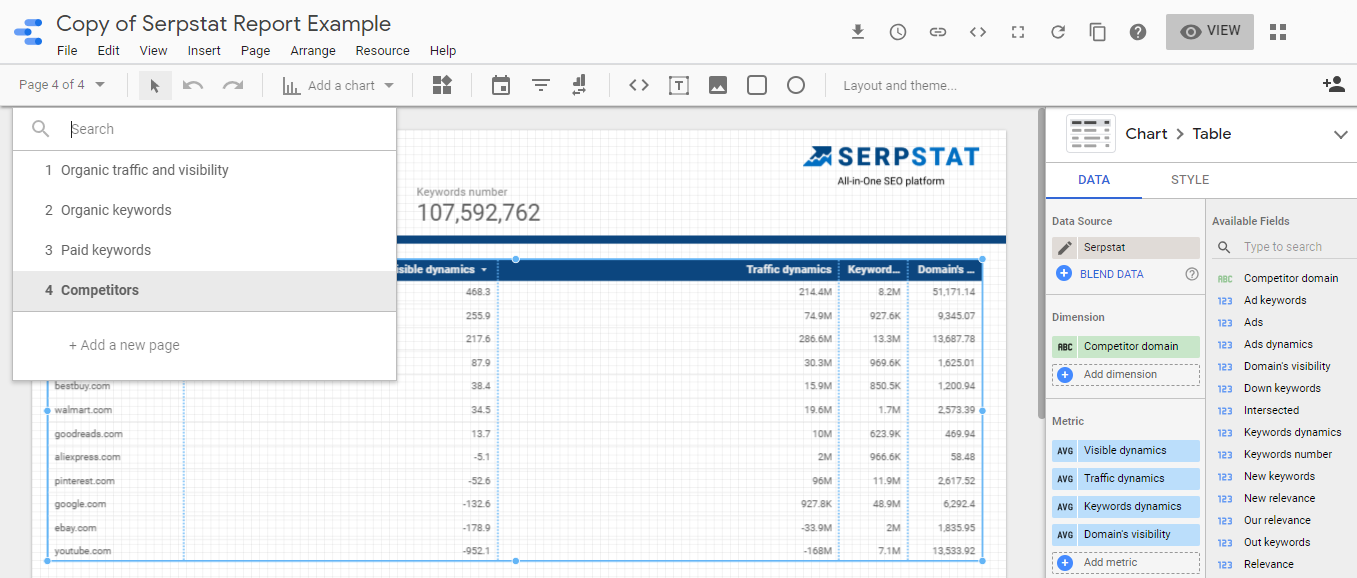
Go to the Competitors report and copy the tables on the page:
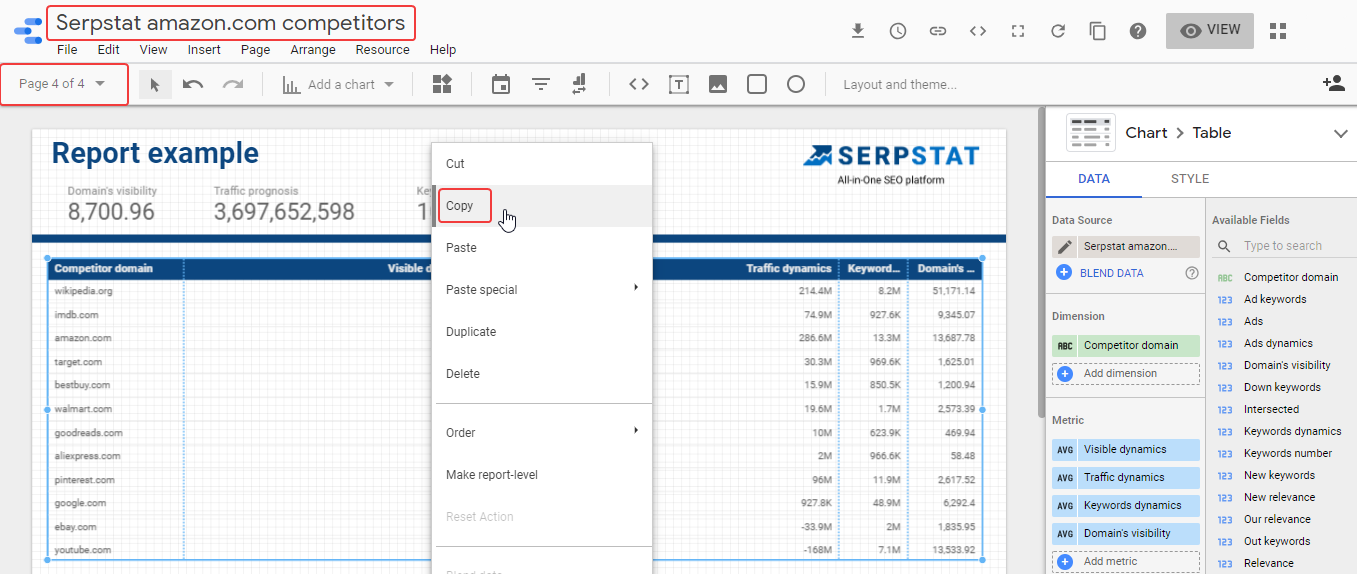
How To Visualize Serpstat Reports Using Google Data Studio Connector 16261788247682
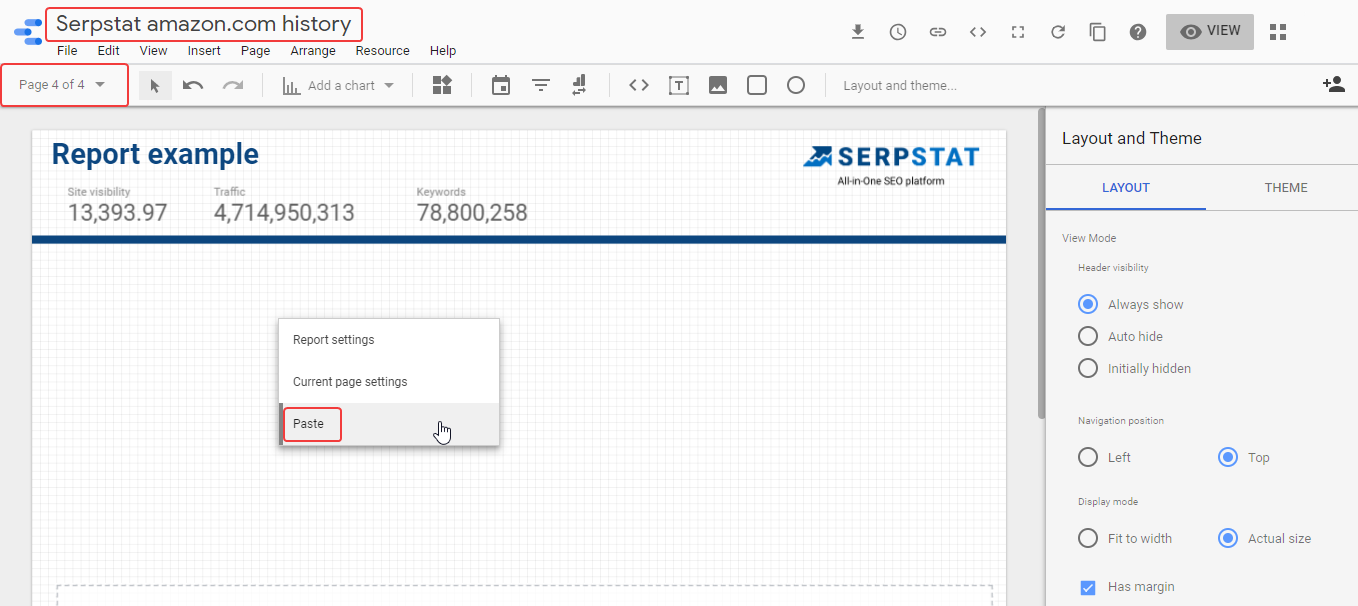
Go to the History report, select the fourth page and insert the data.
Way #2
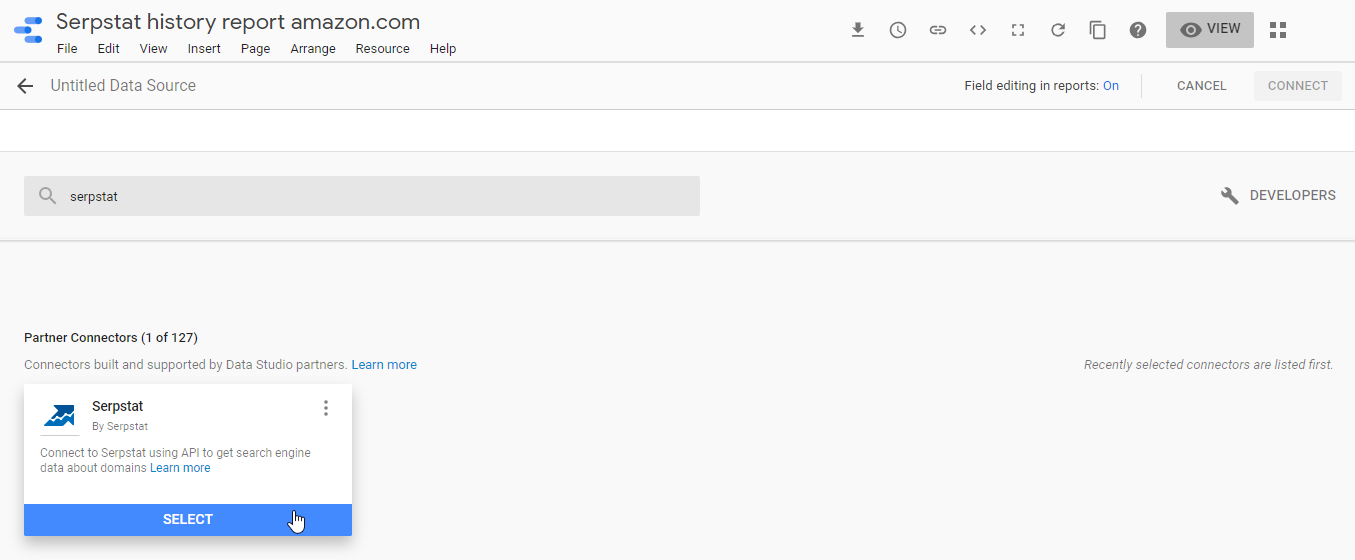
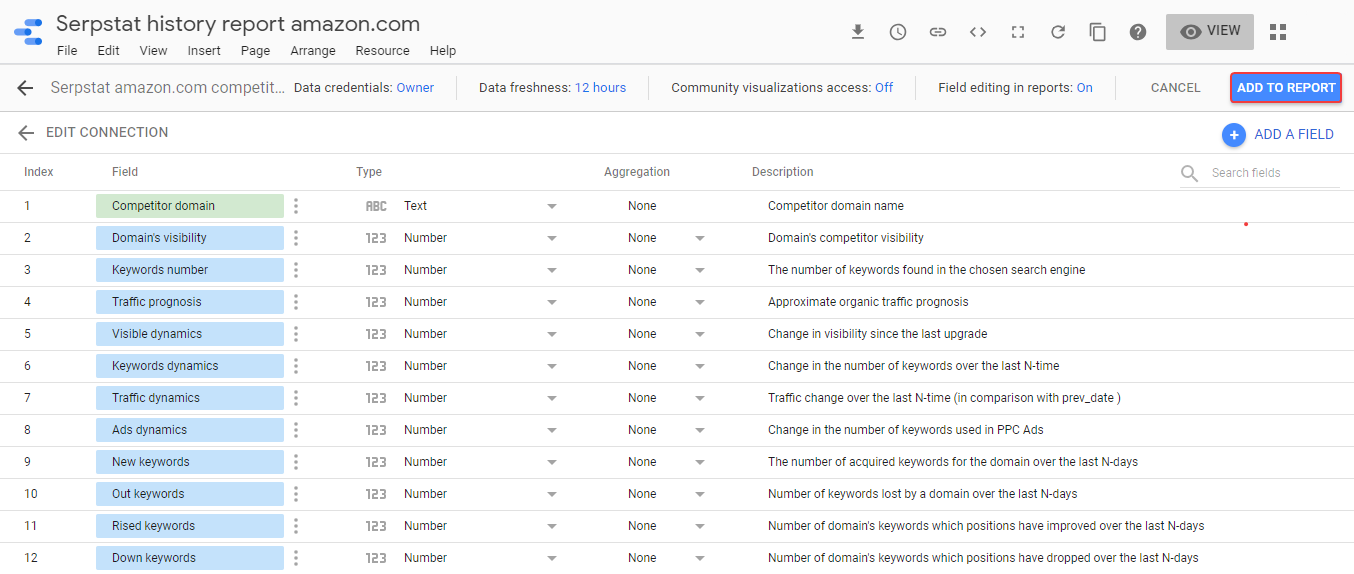
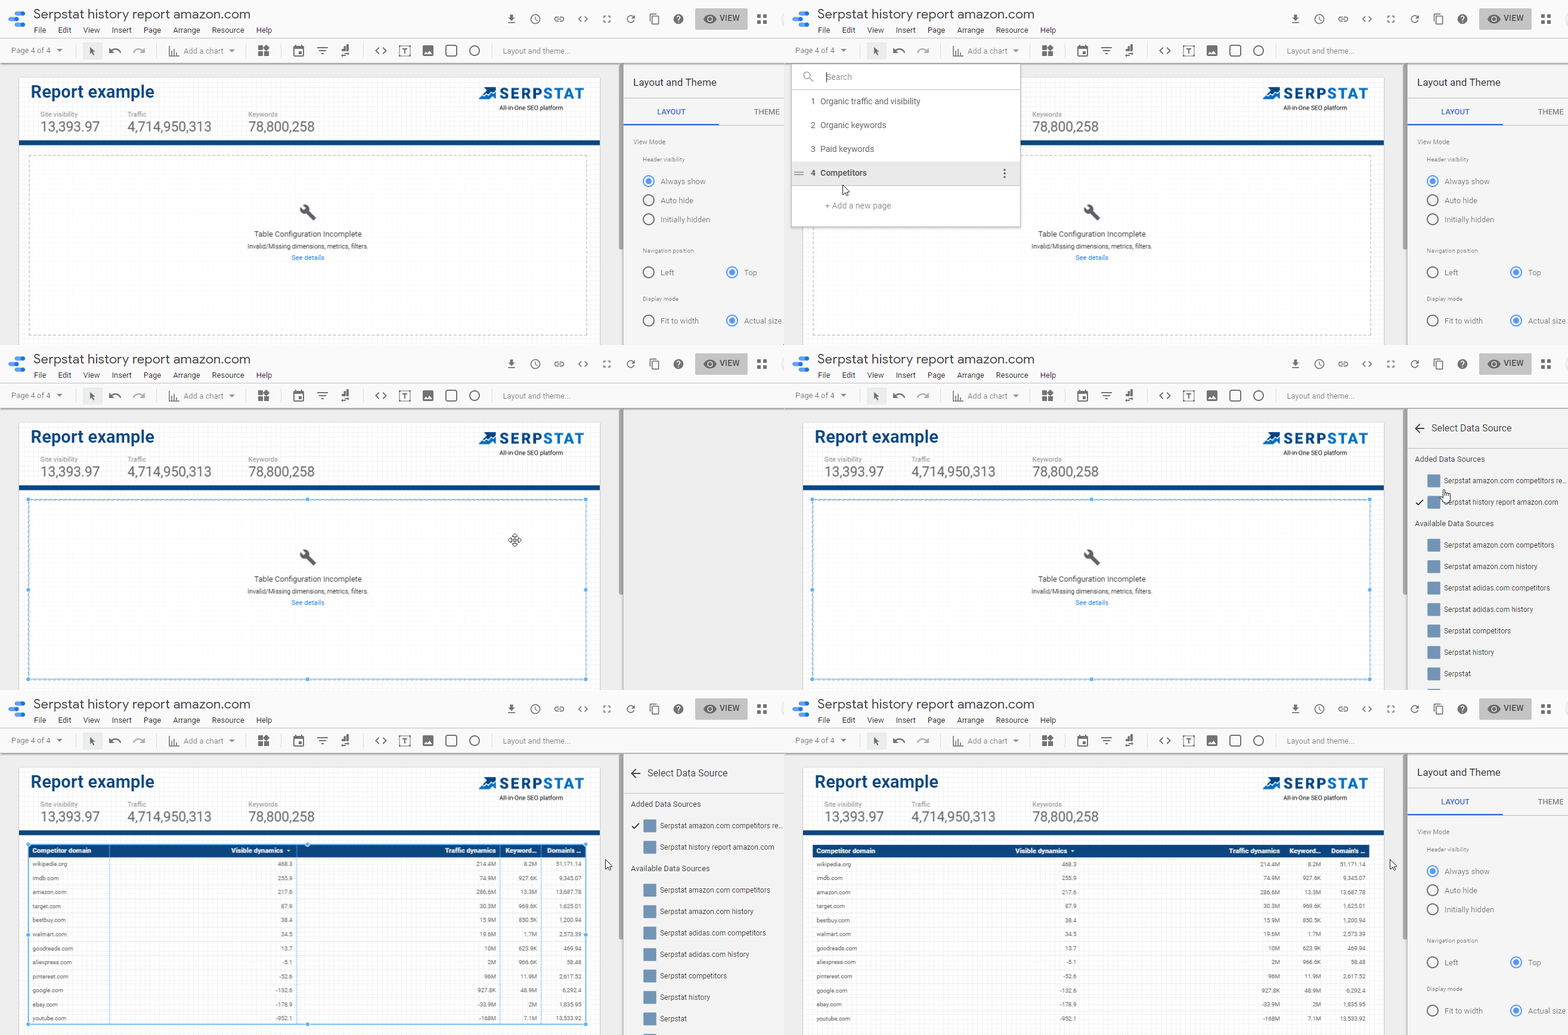
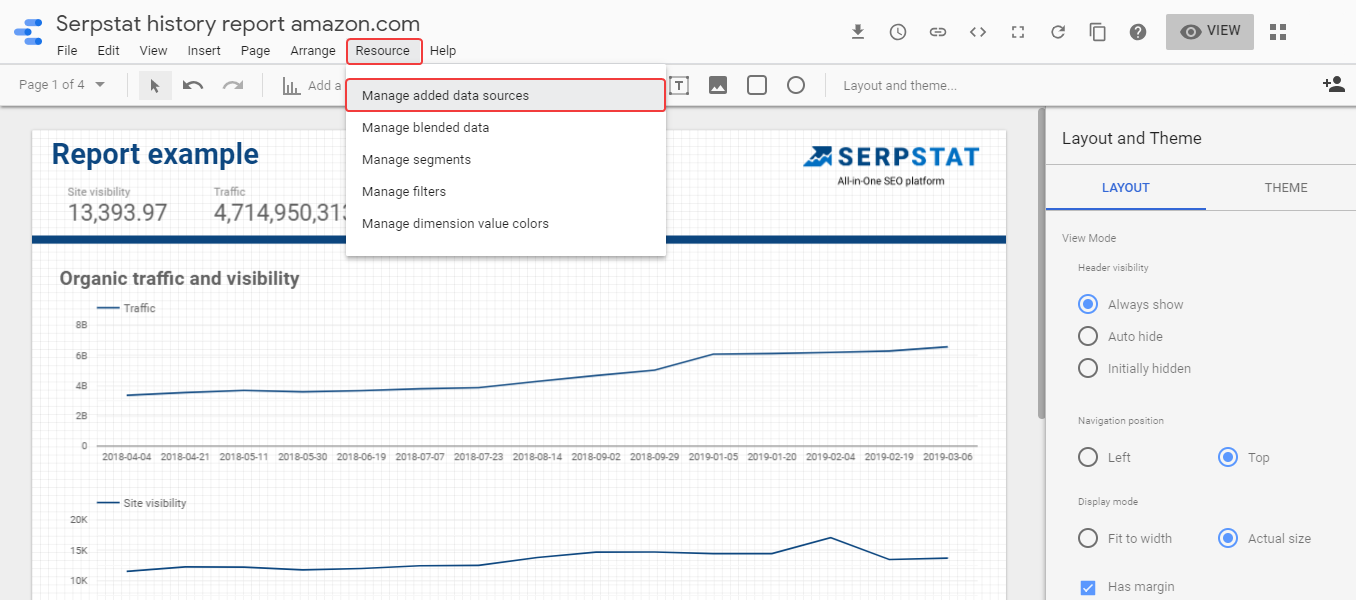
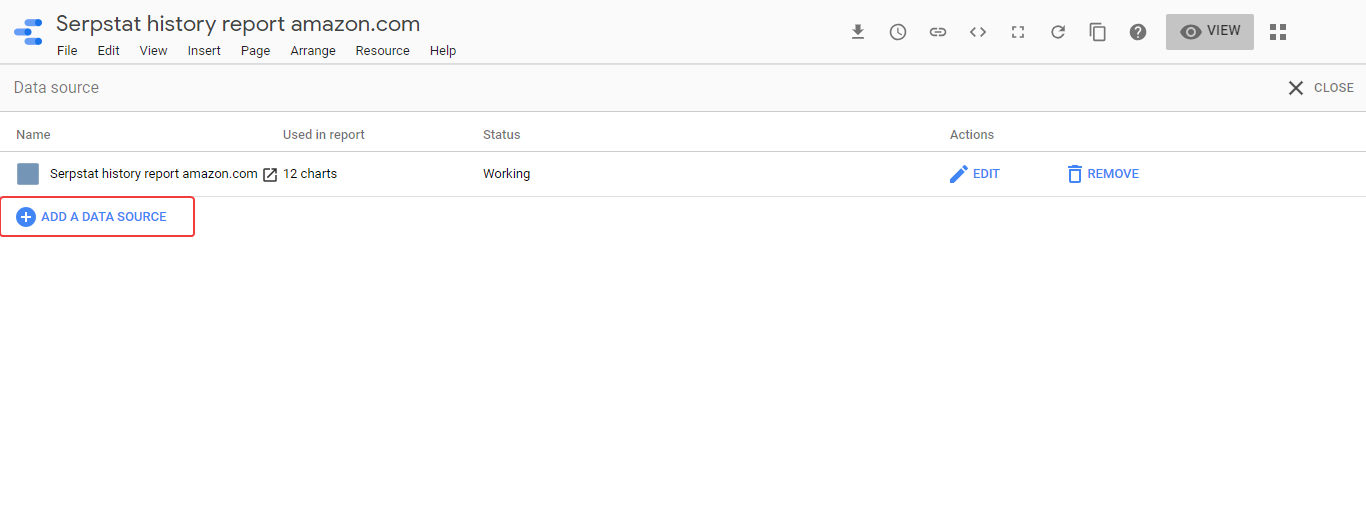
If you don't want to create two separate reports and transfer data by copying, you can do everything in one report. Create the History report. Then go to Resource → Manage added data sources and click on the Add a data source button:
Select Serpstat Connector:
How To Visualize Serpstat Reports Using Google Data Studio Connector 16261788247687
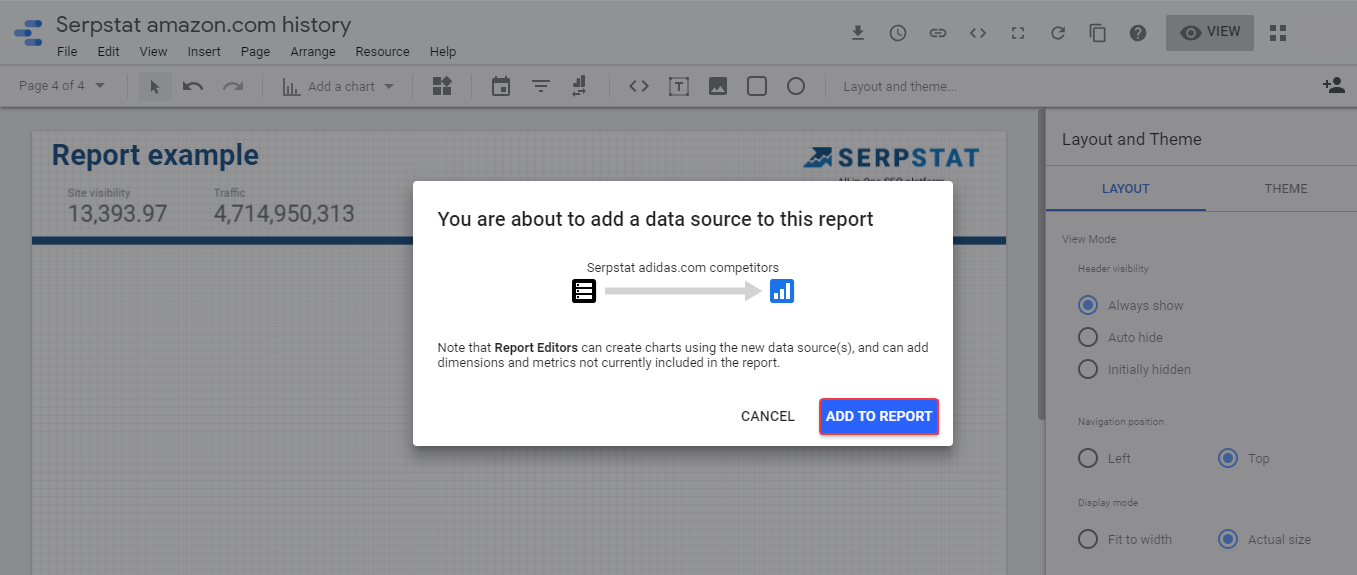
In the configuration window enter the same domain, but choose another report. Then add this data to the history report:
How To Visualize Serpstat Reports Using Google Data Studio Connector 16261788247688
Go to the Competitors tab and add this field to the report:
How To Visualize Serpstat Reports Using Google Data Studio Connector 16261788247688

Cache data storage

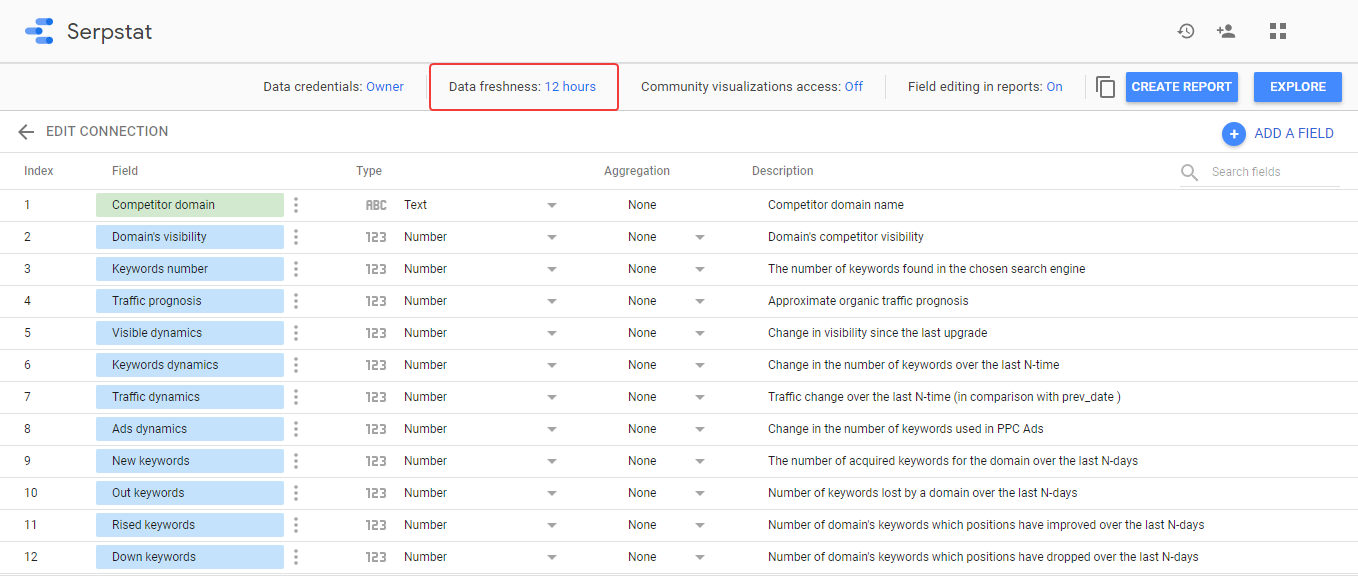
Reports are stored in a cache so you can load them faster. When setting up the connector and creating the report, you will see a note that the data is being updated every 12 hours.
How To Visualize Serpstat Reports Using Google Data Studio Connector 16261788247689
You can set how often the connector should update the data source. For example, sheets can be checked every 15 minutes (default) for 4 or 12 hours to see if there is updated data. Some data sources only support setting by default (12 hours).
The Serpstat connector is set up to repeat the checking every 12 hours. Be careful, as this will result in limits spending.
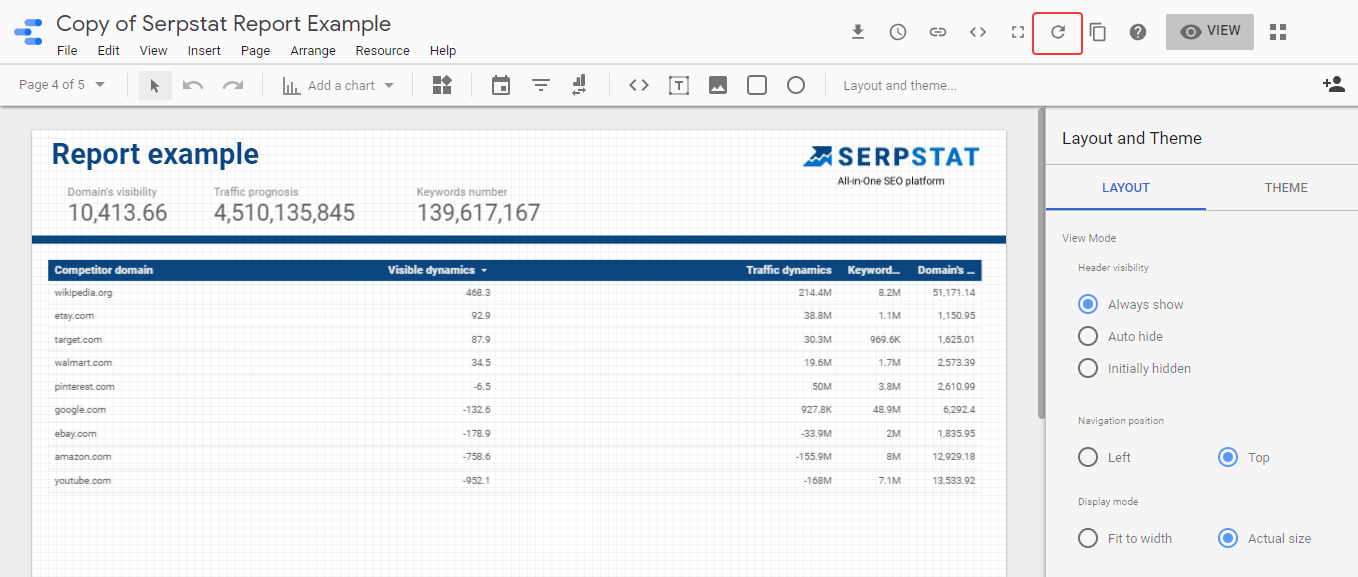
The data can be updated manually at any time in the report:
How To Visualize Serpstat Reports Using Google Data Studio Connector 16261788247690
Or in the Explore tab:
How To Visualize Serpstat Reports Using Google Data Studio Connector 16261788247691
Important! When updating manually, an API request will be sent each time and limits will be removed.
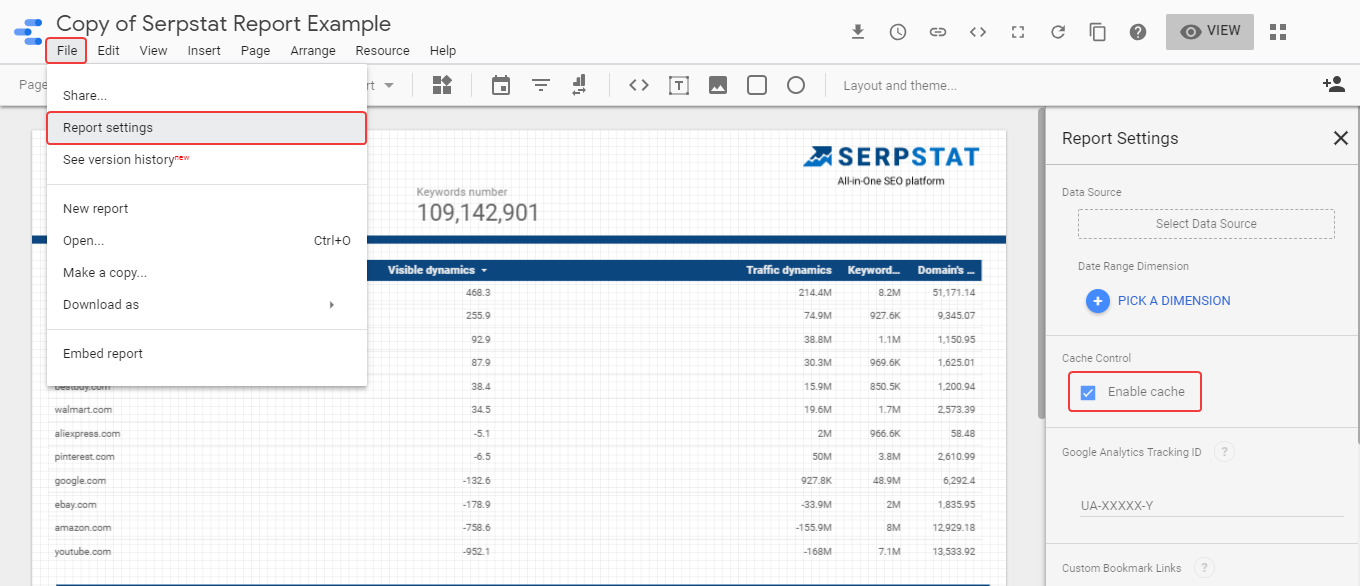
To disable cache data storage, make the following settings:
File → Report Settings → Enable Cache.
How To Visualize Serpstat Reports Using Google Data Studio Connector 16261788247692
With this setting, the manual update is still available.

Access and limits

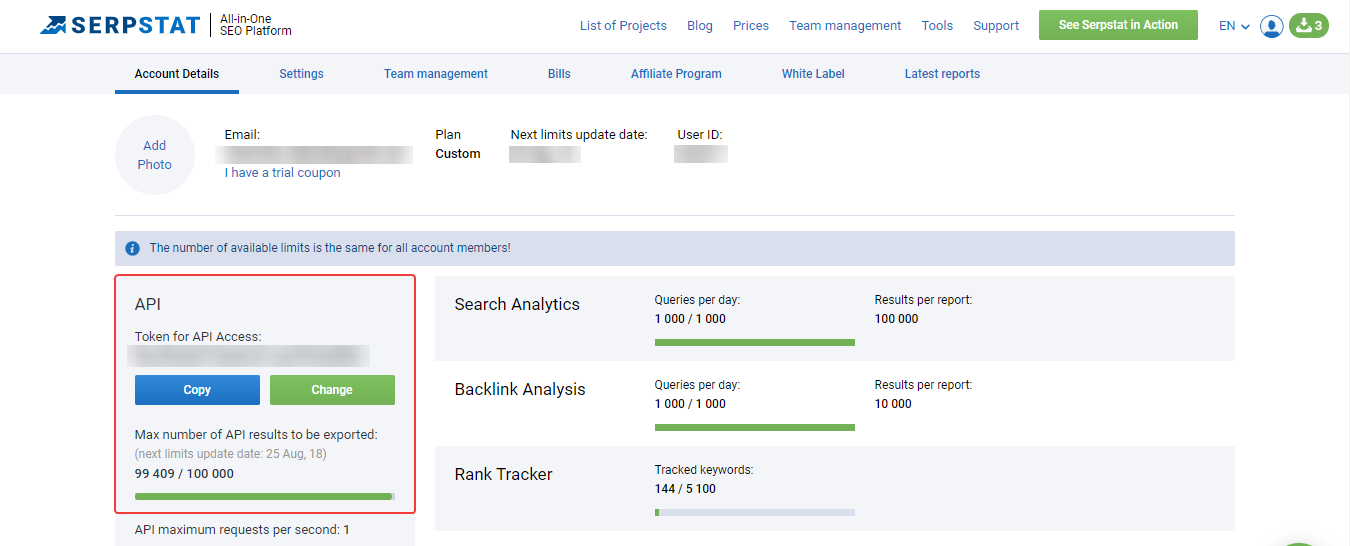
To display Serpstat reports in Google Looker Studio, you should have:

  • a Serpstat account
  • API access
  • personal API token in your profile.

You must have the Max number of API results to be exported credits to create the report in the Looker.
How To Visualize Serpstat Reports Using Google Data Studio Connector 16261788247694
If you don't have the API access, contact the support team by completing a product demonstration form, or you can use our live chat.
Limits are spent while choosing the report type, depending on which method you choose and how many lines of results you get in the finished report. Next limits are spent while updating the report (12 hours each or on request). You can create the report and update it only when needed, thus saving limits.

Summary

Google Looker Studio is a useful tool that lets you visualize data quickly and easily. In combination with Serpstat, it offers unlimited possibilities for analyzing SEO ranking services. To visualize the Serpstat reports, you should:
1
Have the valid Serpstat account.
2
Have API access.
3
Connect Looker Studio using the Serpstat connector.
4
Configure the generated report based on the template according to your needs.

Speed up your search marketing growth with Serpstat!

Keyword and backlink opportunities, competitors' online strategy, daily rankings and SEO-related issues.

A pack of tools for reducing your time on SEO tasks.

Get free 7-day trial

Rate the article on a five-point scale

The article has already been rated by 6 people on average 5 out of 5
Found an error? Select it and press Ctrl + Enter to tell us

Share this article with your friends

Are you sure?

Introducing Serpstat

Find out about the main features of the service in a convenient way for you!

Please send a request, and our specialist will offer you education options: a personal demonstration, a trial period, or materials for self-study and increasing expertise — everything for a comfortable start to work with Serpstat.

Name

Email

Phone

We are glad of your comment
I agree to Serpstat`s Privacy Policy.

Thank you, we have saved your new mailing settings.

Open support chat
mail pocket flipboard Messenger telegramm