Google Looker Studio SEO Connector
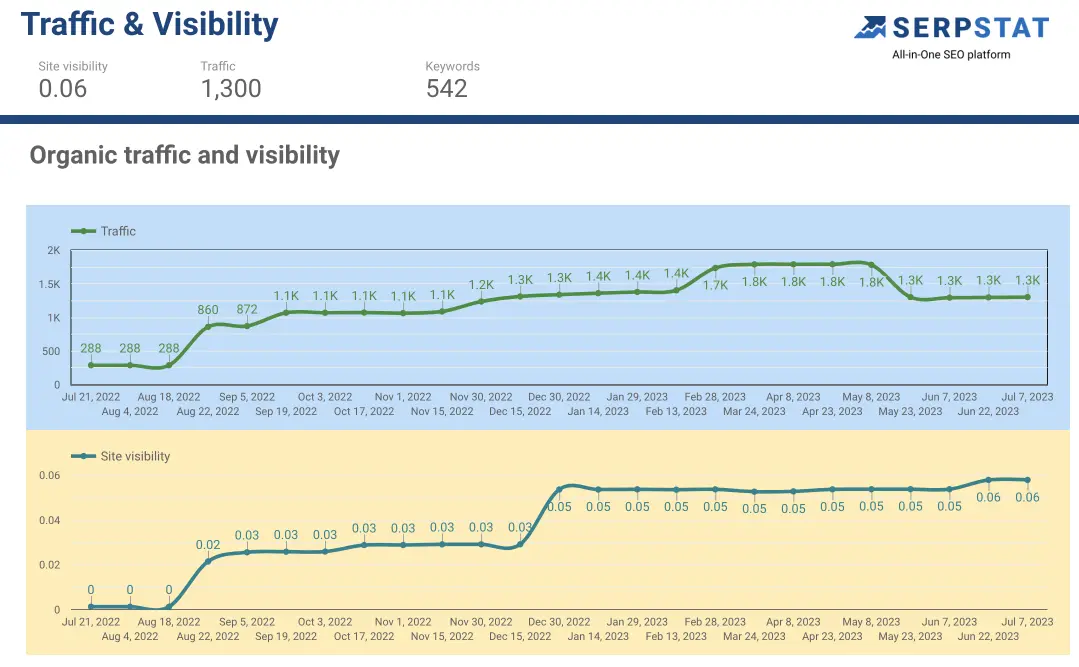
- Use all opportunities of Looker Studio – create informative charts, diagrams, trends and visualize data.
- Create custom dashboards with Serpstat's SEO data and make it easier for clients to evaluate the progress of website optimization.





What is Google Looker Studio?
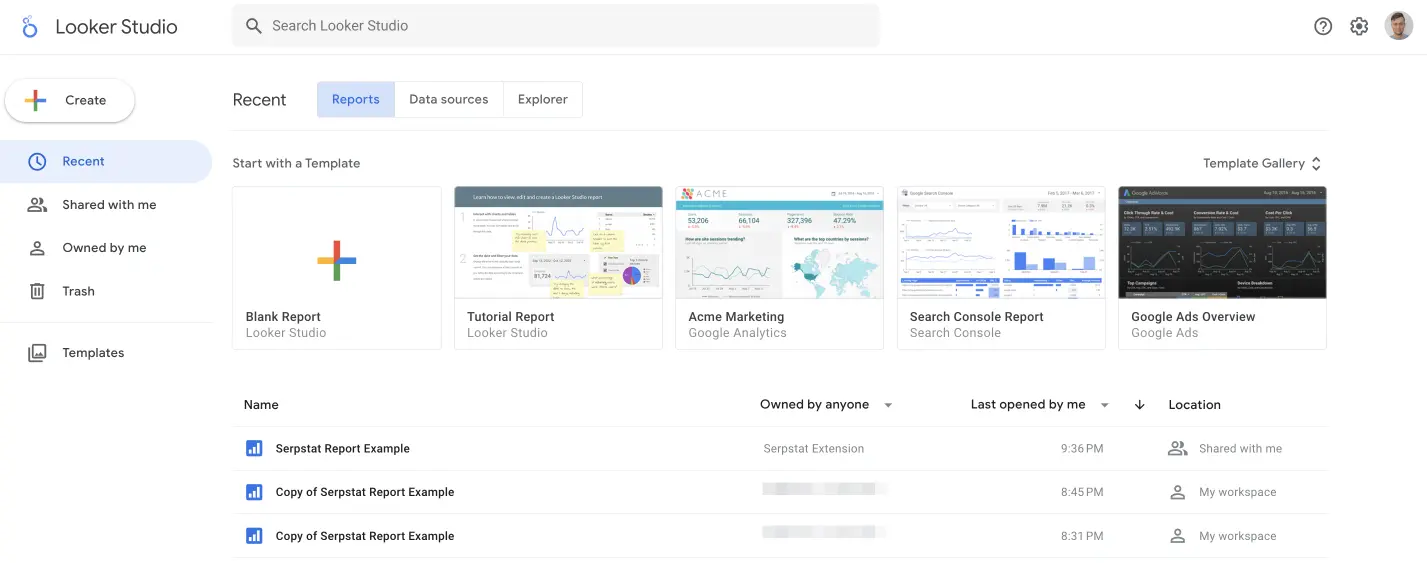
Google Looker Studio is a Google product that allows you to visualize any data as an informative, readable report that is easy to share and analyze. Reports are fully customizable for user tasks and can contain any kind of charts, maps, images, and tables.
Who needs Google Looker Studio SEO connector?
The connector will be useful for Serpstat users who work with large amounts of data:
- SEO professionals who need in-depth data analytics and don't want to miss a single detail in their reports
- Marketing agencies to create understandable reports for presentation to clients and search for insights
Tasks that can be solved using the Google Looker Studio connector
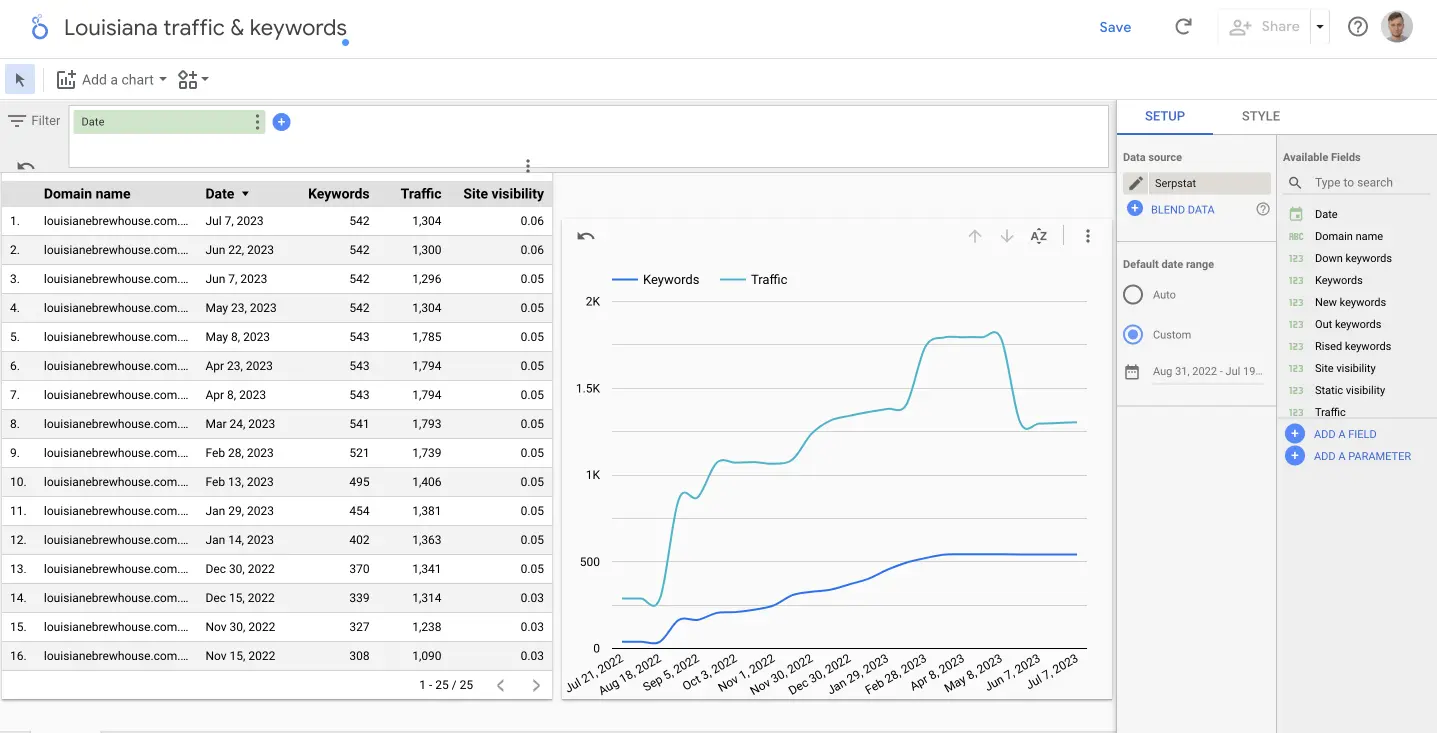
- Creation of customized reports with SEO data containing any kind of charts, histograms, tables and images
- Accurate and fast SEO analytics because of the visual data display, automatically extracting data and built-in formulas
- Effective presentation of SEO data reports for clients and team members
- Simultaneous editing of tables with reports for any number of users
Looker Studio SEO Connector FAQ
How to visualize SEO data as a report?
If you work with a large amount of data and need to analyze or present it to clients, use the Serpstat connector with Google Looker Studio. This integration will allow you to present data about the competitors of the site and the history of the domain in visual form with graphs and charts. The data in the table is updated automatically, which allows you to track the latest SEO analysis data without having to switch to the interface of the Serpstat tool.
Which plan do I need to use connector with Google Looker Studio?
Connector requires API credits, access to API is granted starting from Team plan.
How are credits charged for using connector with Google Looker Studio?
When using the connector, Serpstat credits are charged depending on the analyzed site and the type of data (one query for competitors ≈ 20 credits, one query for domain history ≈ 30-50 credits).
How to use Google Looker Studio?
To use the tool for creating visual reports with flexible settings of Google Looker Studio follow next steps:
- Open Google Looker Studio; select a data source (for example, Google Analytics or Search Console), select the required account and resource and click Create Report, then confirm that you wish to add the data source to the report.
- Create a dashboard by adding a title, data filter, and top and bottom report borders.
- Choose the desired type of data display: pie chart, bar chart, graph, table, or other relevant option.
- Add formulas for calculating indicators to the interface to create new fields and save them.
- Add a block with key indicators of the table to its top panel so that important data is always in sight.
Use tables from Google Looker Studio to analyze data and create reports for clients.

