Start Exploring Keyword Ideas

Use Serpstat to find the best keywords for your website

PPC June 27, 2019  |  30618   134   |  18 min read  – Read later

The Complete Guide To Google Analytics

The Complete Guide To Google Analytics 16261788104738
The Complete Guide To Google Analytics 16261788104739
Ryan Cruz
Co-founder at Traffic Salad
According to Google and Econsultancy's research, about 60% of leading marketers use analytics to make strategic decisions for their business. You've probably installed and used Google analytics before, but I'm pretty sure that you still haven't used its full potential yet.

That's about to change because in this comprehensive guide of Google analytics you'll discover how to use Google analytics properly to track, measure, and analyze metrics that really matter for growing your business.


How to install and setup Google Analytics the smart way

If you have already installed Google Analytics, skip this part. This first part will teach you how to install Google analytics properly on your website. But even if you've installed Google analytics before there are still some tips here that will be valuable for anyone who uses it.
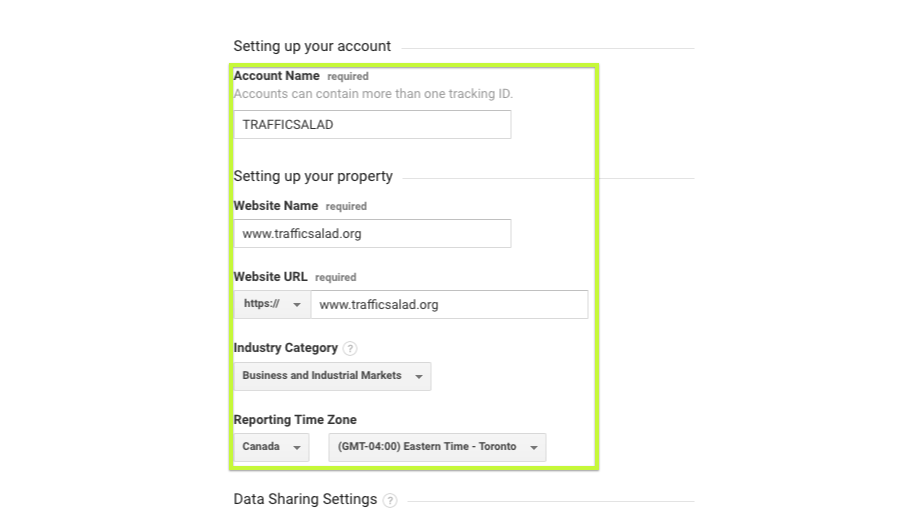
1. Use a Google account to create your Google analytics account.

2. Setup an account name. I usually use the domain name or business name on the account name.

3. Setup a website name. I just use the domain name here.

4. Then enter your website URL. If you have SSL or a secure site, make sure you use https://

5. Choose your industry category.

6. Then choose your time zone.

7. Data sharing settings. I just leave this setting on default. (optional)
The Complete Guide To Google Analytics 16261788104740
8. Grab the Google analytics tracking code and add it on your website.

In order to connect your new Google analytics account with your website, you need to add the Google Analytics tracking script to your website's header. This requires a little bit of technical and coding skills, so if you don't have a developer, you might need to research how to add this code on your website.

Another alternative in installing Google Analytics is by using some plugins to install and connect it for you. Some platforms like WordPress have Free plugins that will install Google Analytics on your website in just a few clicks.

Lastly, you could also use Google Tag Manager to install Google analytics (and other scripts) on your website easily. Here's how a Google Analytics Tracking code should look like:
<script> 

(function(i,s,o,g,r,a,m){i['GoogleAnalyticsObject']=r;i[r]=i[r]||function(){ 

(i[r].q=i[r].q||[]).push(arguments)},i[r].l=1*new Date();a=s.createElement(o), 

m=s.getElementsByTagName(o)[0];a.async=1;a.src=g;m.parentNode.insertBefore(a,m) 

})(window,document,'script','https://www.google-analytics.com/analytics.js','ga'); 

ga('create', 'UA-XXXXXXXX-X', 'auto'); 

ga('send', 'pageview'); 

</script> 
This code should be installed on the <head> portion of ALL the pages on your website.


Google Analytics: What does it consist of?

If you skipped the previous part, stop here. I'd like you to log into your Google analytics account and follow me along as I dive into detail in each section of Google Analytics.

Home section

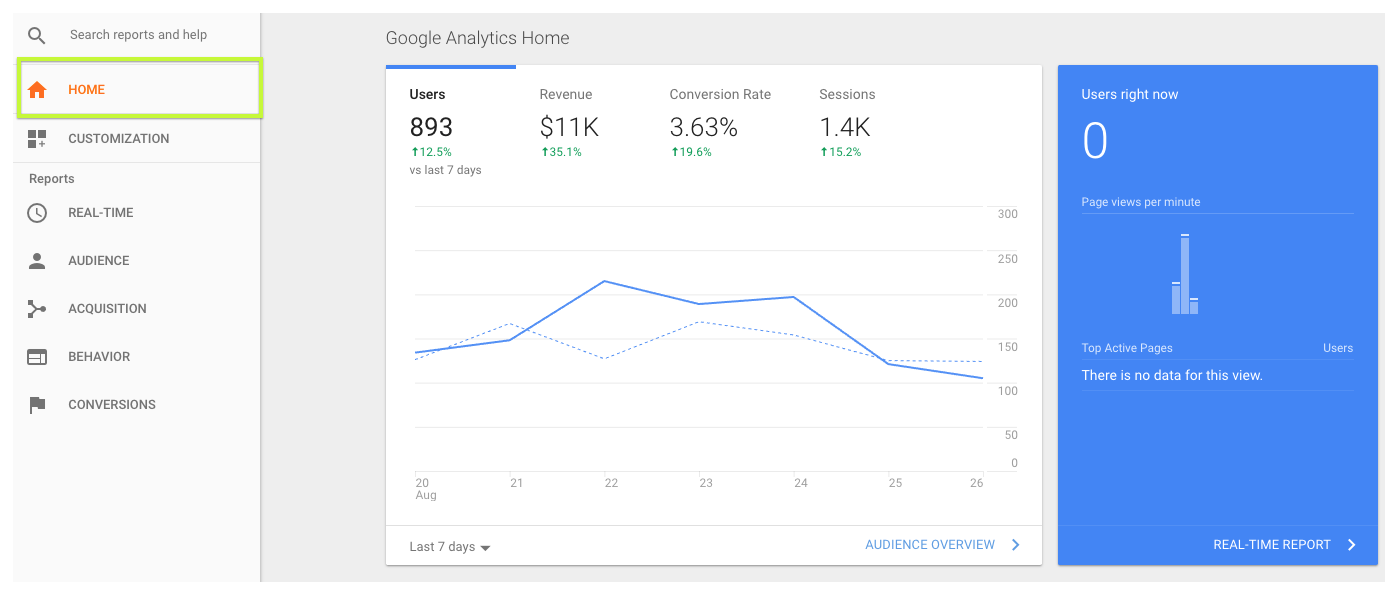
Now browse to the left tab of your Google Analytics account. Let's start with the Home Section. The home section is a new dashboard that Google has introduced into Google analytics recently. In this dashboard, you can quickly have a bird's eye overview of how your website is doing.
The Complete Guide To Google Analytics 16261788104740
It shows how many users have visited your website in the past 7 days, your revenue (if ecommerce tracking is configured), the conversion rate for your goals and how many sessions were recorded.

Sessions are higher than users because some users might have multiple sessions (instances where they've visited your website.

Customization section
In the customizations tabs, you'll find the dashboards, custom reports, saved reports and custom alerts. Aside from the Home dashboard that I've shown you, you could create your own custom dashboard that can be used to quickly check for different metrics without having to spend a lot of time finding it on analytics.
The Complete Guide To Google Analytics 16261788104741
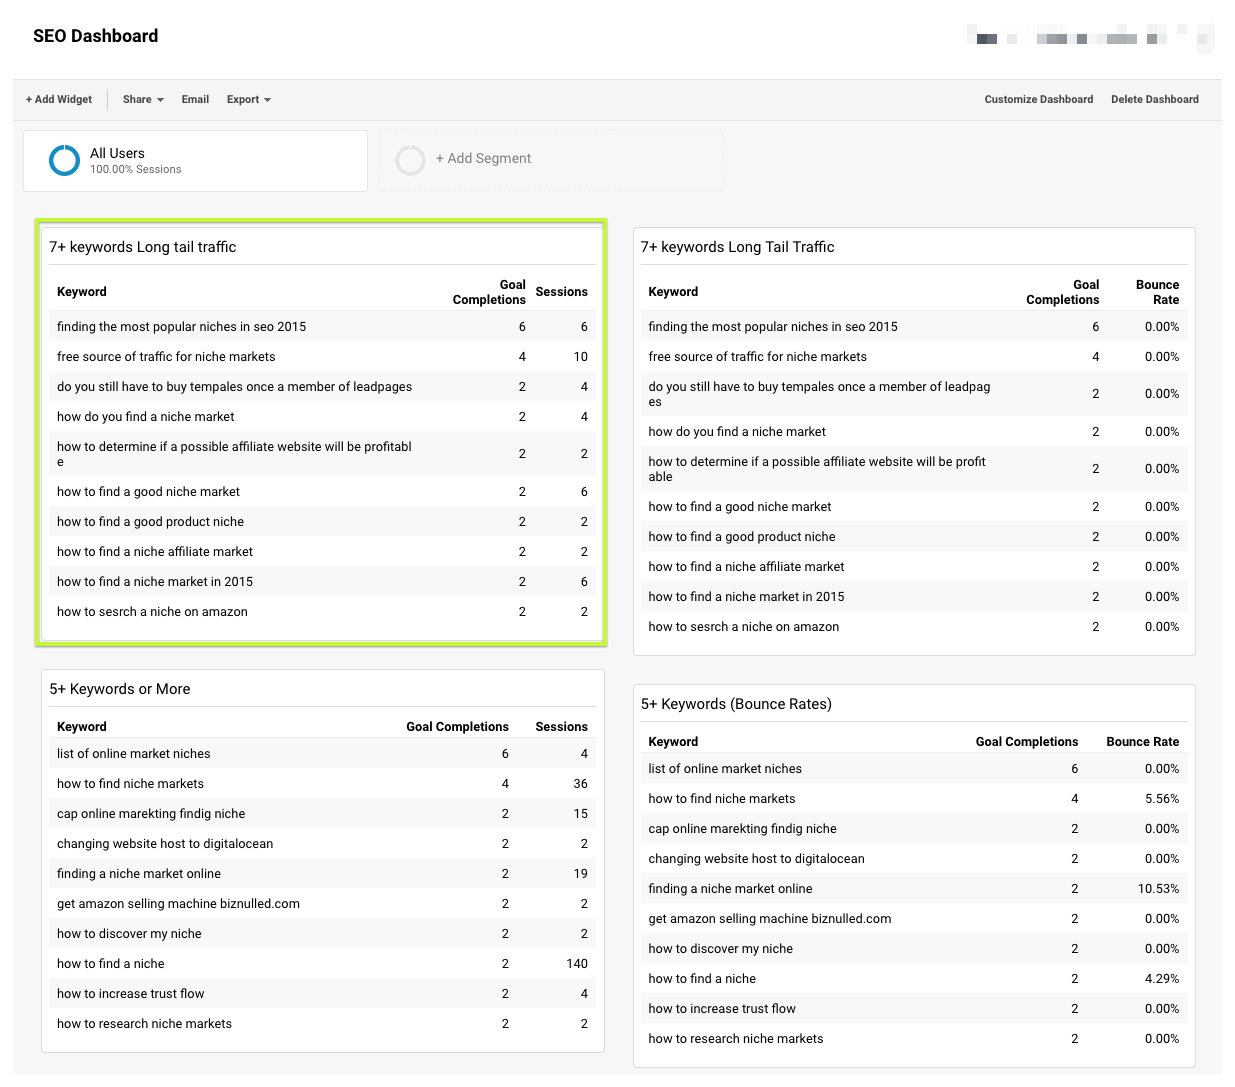
An example of how I'm using custom dashboard is my SEO dashboard. This custom dashboard allows me to discover which long tail keywords got me conversions as well as how many sessions did that particular search query received.

And you can share custom dashboard formats (without sharing private data) to anyone who has Google Analytics. If you'd like to have a copy of this SEO dashboard on your own Google Analytics account, click here.
Aside from creating your own custom dashboards, you could also create customized reports that can be used to create easy to understand reports for different members of your team. You can definitely create reports for your boss, your marketing manager, your advertising team, etc. The sky is the limit with custom reports.

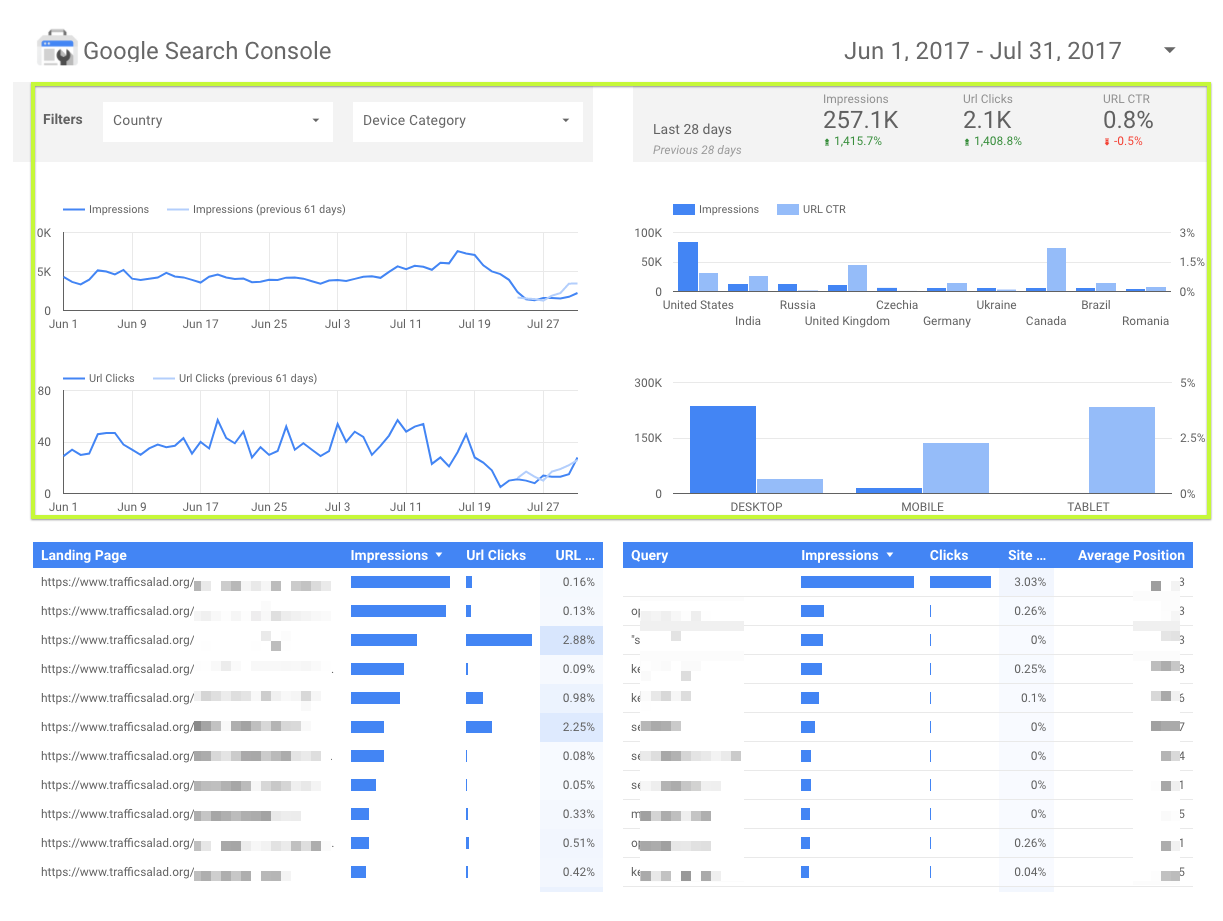
And now that Google has released Google Data Studio for free, you can even create more beautiful reports without purchasing expensive reporting software.
Just check out these beautiful report (Search console report) created with Google Data Studio.
The Complete Guide To Google Analytics 16261788104741
If you want to be notified via email or SMS for any significant changes in your traffic or stats, you can create a custom alert.


Real-Time section

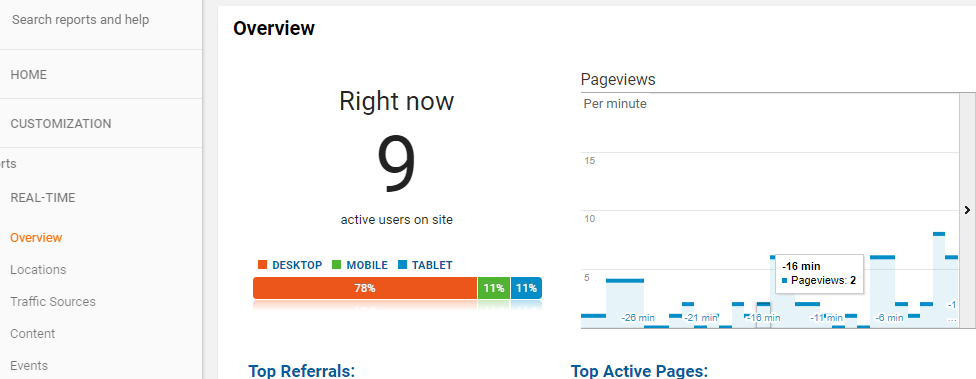
This section shows you real time stats of your website's visitor. (There's a delay of a few minutes) but it's very useful to check if Google analytics is working on your website.

The real time tab can help you get more granular in your analysis by segmenting by location, traffic sources, content, events, and goals.
The Complete Guide To Google Analytics 16261788104742


Audience Section

 
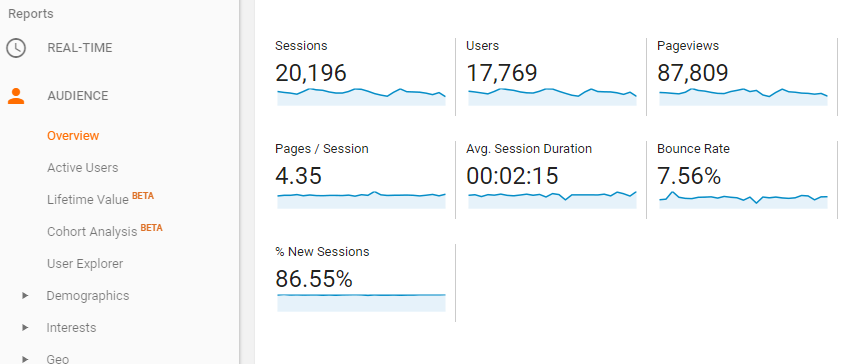
In the audience overview tab, you can get a quick insight about the people visiting your website. This will help you understand their interests, demographic profiles and how they behave on your website.

A session is a group of user interactions with your website that take place within a given time frame. That time frame is usually after 30 minutes of inactivity or after midnight. A user can have multiple sessions, and one of the best ways to explain this difference is by an example. For example, John visited your website and left a page open for about 31 minutes because he took a break. When he continues that session after 31 minutes, it will then be counted as 2 sessions even though a page has been left open and the 30 mins timer will then be reset.

For the other site metrics, I also look at the bounce rates of particular pages on my website. A 70% bounce rate means that out of 10 visitors, 7 of your visitors are just bouncing off your site. Optimizing and improving your website's bounce rates should be one of the parts of Conversion Rate Optimization strategies to increase conversions on your site.

For pages per visit, the more pages that are being visited by your users, the better it is. Ideally, that means that people are reading more of your content.
The Complete Guide To Google Analytics 16261788104742
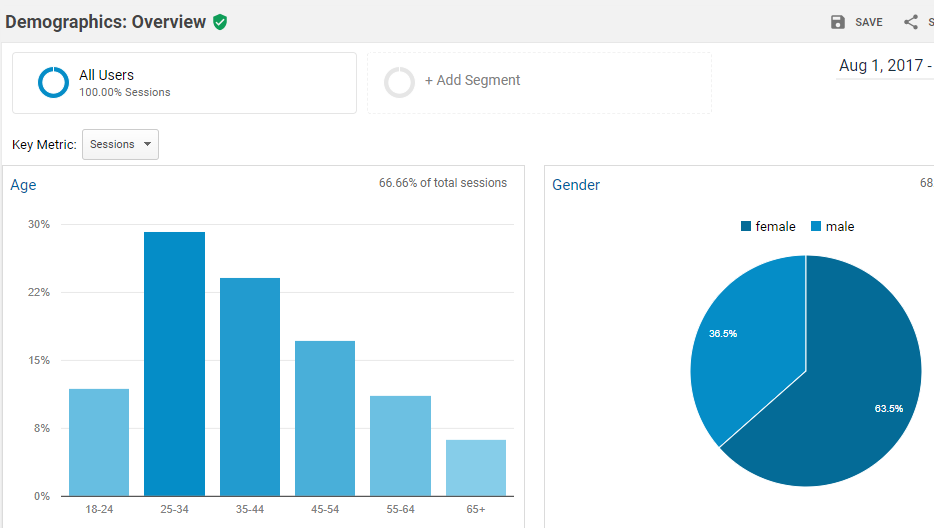
Would you like to know the age and gender of your website visitors? The demographics tab holds that information.
Pro Tip: You can use Segments to dive deeper into a particular segment.
The Complete Guide To Google Analytics 16261788104743
Interests Tab is where the audience tab gets more interesting. You can use this data if you're going to create advertising displays, banners and targeting for your ads.

If you're looking for buyers, look into the affinity and in-market segments to identify which segments are getting conversions. You can also use the data that you've discovered in interests to create your Google Adwords Display marketing campaign.
The Complete Guide To Google Analytics 16261788104743
Want to know what language and location are your visitors coming from? Use the Geo Tab to find that out.
The Complete Guide To Google Analytics 16261788104743
Don't ignore the Behavior section as this is crucial to understanding how your website visitors are 'behaving' on your website.

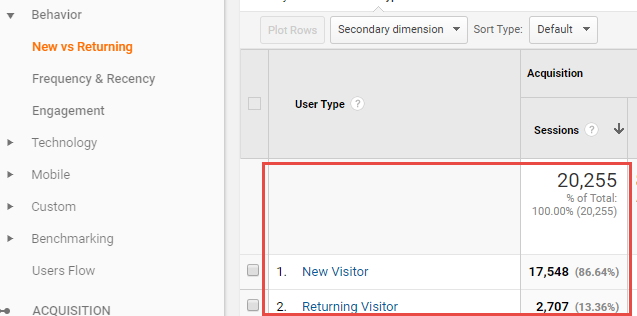
New vs. Returning Visitors — you'll want more people to return back to your website. When people return to your website, they'll usually convert higher because they are already familiar with your brand and website. Some of the strategies that will help bring more people back to your website is by sending out emails to your newsletter subscribers.
The Complete Guide To Google Analytics 16261788104744
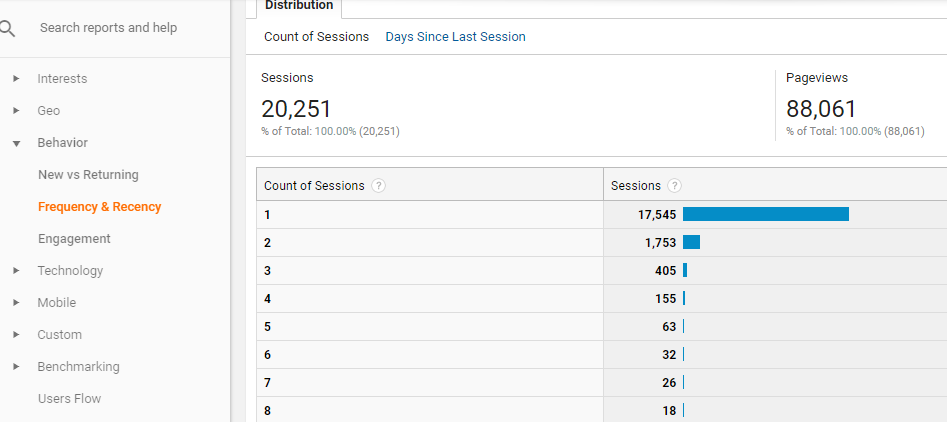
Frequency and Recency — by looking at the number of sessions on your website, you'll know how many sessions are being regenerated by repeat visits on your website.
The Complete Guide To Google Analytics 16261788104744
Want to know if youк readers are digging your content? Are they spending enough time on your website or are they bouncing off? Engagement Tab will show you the approximate session duration of most of your visitors. If it's usually less than 10 seconds, then you'll want to check why people are mostly bouncing off your website.

Technology Tab is a tab that I didn't use a lot. It showcases the browsers that your website visitors are using. Unless you need to optimize for a particular website browser, then you probably won't be using the technology tab soon.

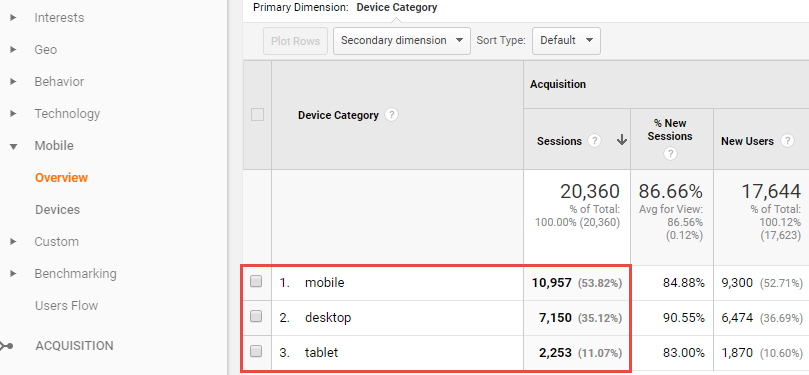
Mobile Tab: In 2015, Google announced that mobile standard to surpass desktop in terms of "in the moment" searches. Searches like "I want to know", "I want to buy", "I want to go". This tab will show you if your website is getting more mobile traffic than desktop traffic just like what this website shows.
The Complete Guide To Google Analytics 16261788104745
So what do you do when this happens? First, make sure that your website is mobile friendly and that it loads quickly. Google even released a website to test if your website is optimized and mobile friendly. Just enter your website here to test it out.

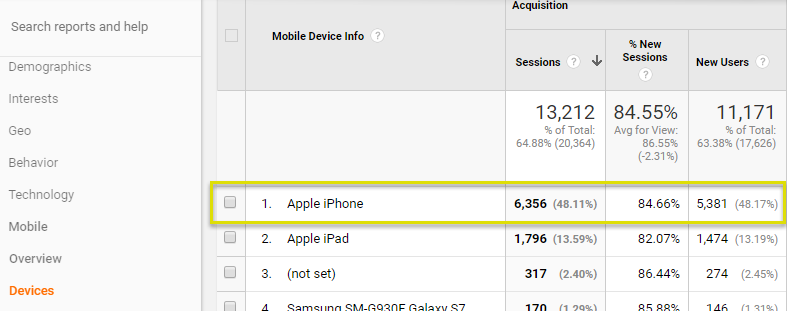
Another analysis you could do on the mobile section is to check which mobile devices dominates your website traffic. In this example, it clearly shows that almost half of the mobile visits are coming from an Apple iPhone device, yet conversion on this device is almost half of an Apple iPad.

My solution for this would be to make sure that the website loads and is optimized properly for an iPhone device.
The Complete Guide To Google Analytics 16261788104746
Sometimes, you'll want to use custom variables and user defined metrics and you'll be able to analyze them in Custom Tab.

Benchmarking Tab
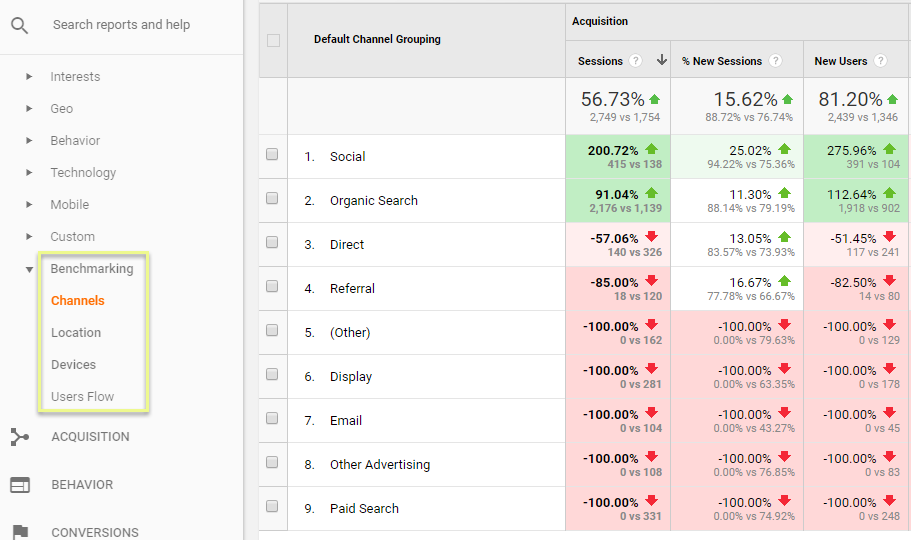
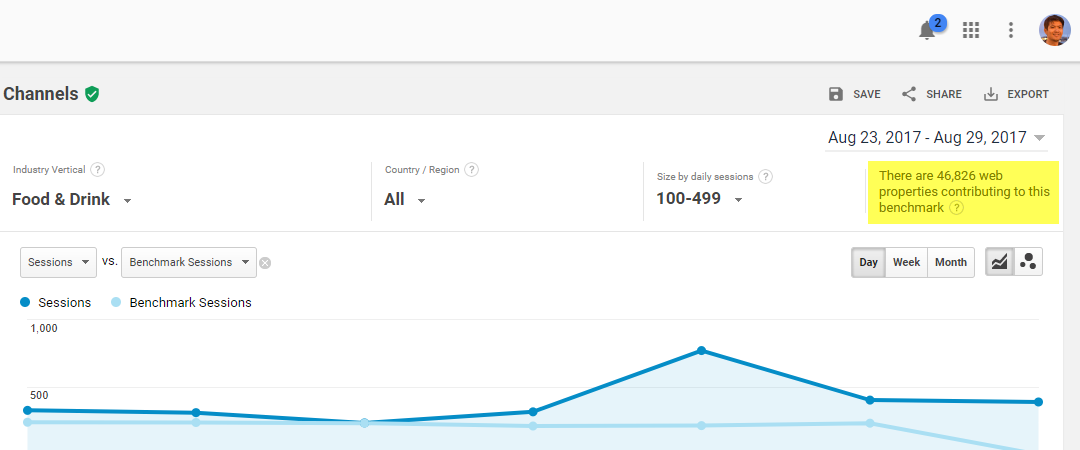
is a new and interesting feature of Google Analytics because it uses other site data to compare your site's metric with other websites that are part of the network for benchmarking. (You may have remembered checking an option to be included in this benchmarking process anonymously when you first setup Google analytics).
The Complete Guide To Google Analytics 16261788104746
You can benchmark against the different sources of traffic for your site by channel. You can also benchmark by location and devices and see how your website performs over others in the same industry.
The Complete Guide To Google Analytics 16261788104747


Acquisition section

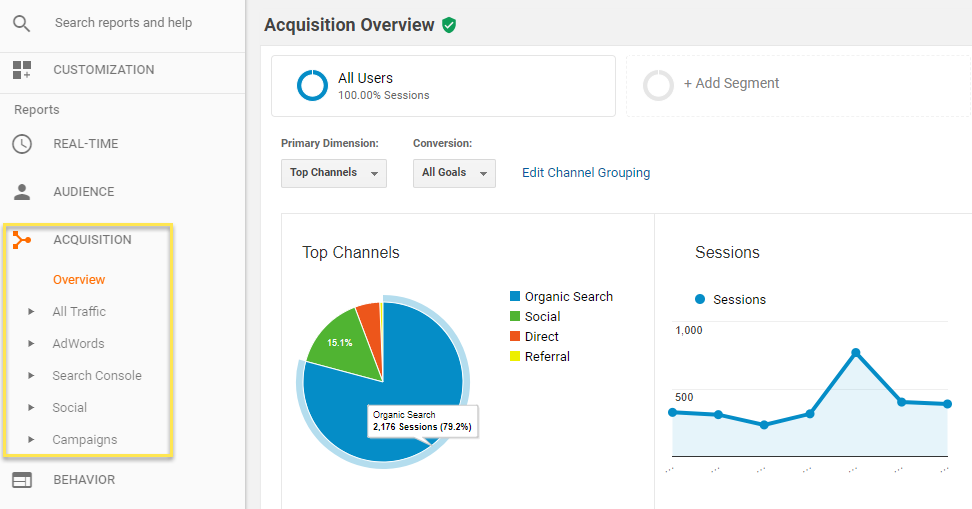
This section talks about how your website is "acquiring" traffic from different channels. This is a screenshot of the overview section and you'll be able to immediately see what is your top channel visually in the form of a pie graph. For this example, it clearly shows that 79.2% is coming from organic or free traffic from the search engines.
The Complete Guide To Google Analytics 16261788104747
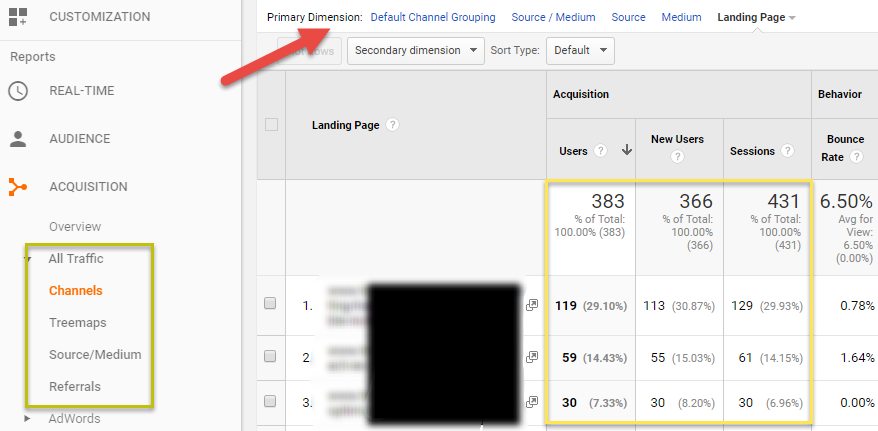
In the All traffic tab, you'll be able to check different metrics on how you acquired your customer. There are many ways to use this section. One of them is by changing the Primary dimensions and Secondary dimensions to find what you are looking for. Let's say I wanted to know which "landing pages" are getting the most traffic, I'll change the primary dimension to "landing page," and then I'll see which pages have the highest session visits.

Source/Medium breaks down your traffic whether it came from organic, paid, email, direct or referral and if came from Google, Facebook, Bing, Yahoo or any other third party website.

The referrals section will quickly show you what third party websites brought traffic to your website. Whenever I see a new website that is referring traffic to my site, I'll try to check what this site is all about and why they started to link to my site.

Usually, it's because they've mentioned one of my articles, in which I'll personally reach out and thank them for linking to one of my articles.
The Complete Guide To Google Analytics 16261788104748
Google Adwords tab: If you're running Adwords, you'll want to connect Google analytics and Google Adwords together because you'll be able to leverage the advance tracking features of Analytics into your Adwords campaigns.

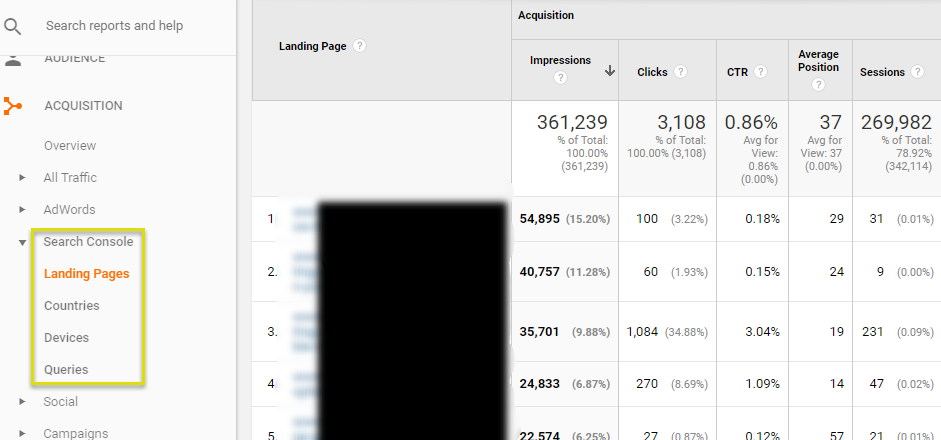
Search Console is one of my favorite sections in Google Analytics. But in order for this to work, you'll need to connect your Google Webmaster Search Console with Google Analytics. Most SEO optimizations for your website can be done and fixed within Google Search Console.
The Complete Guide To Google Analytics 16261788104748
Take note that the search console section only provides information about your Google organic traffic. Bing has a similar search console (that you need to setup separately) called Bing Webmaster Tools if you want to check the search metrics of your site on the Bing network.

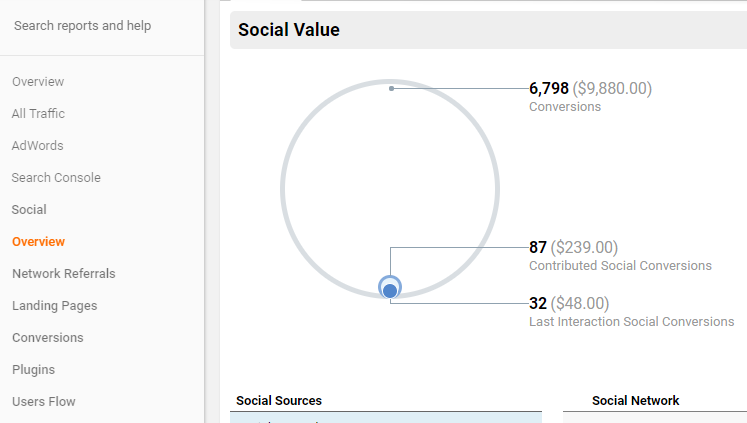
In Social tab, you could check how your website acquired visits from social networks and how it performed (goal conversions). The Network referral provides you with more information about the exact social networks like YouTube, Facebook, etc that drove traffic to your site.
The Complete Guide To Google Analytics 16261788104748
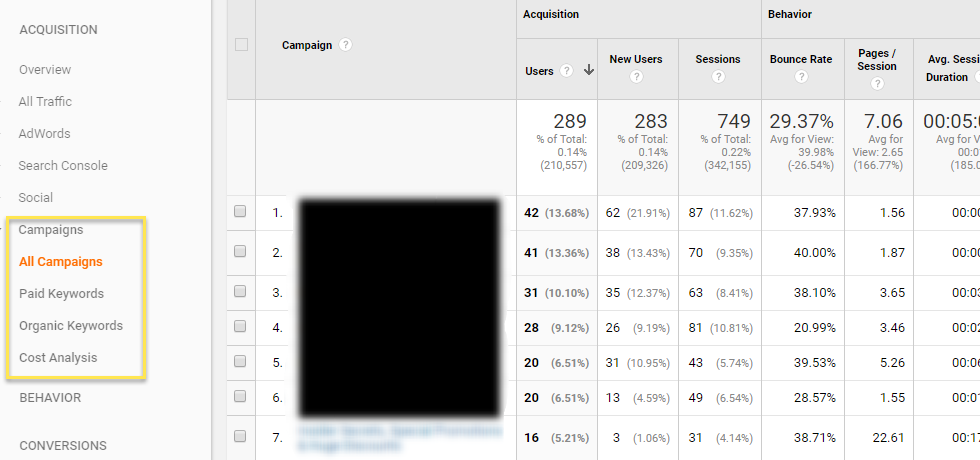
If you're using Google Analytics builder or Google Adwords, you'll find those campaigns at Campaigns tab. I usually use Google Analytics builder to tag specific email campaigns. By doing this, I could measure the performance of my email campaigns using Google Analytics and start measuring bounce rates, pages/sessions, etc.
The Complete Guide To Google Analytics 16261788104749


Behavior section

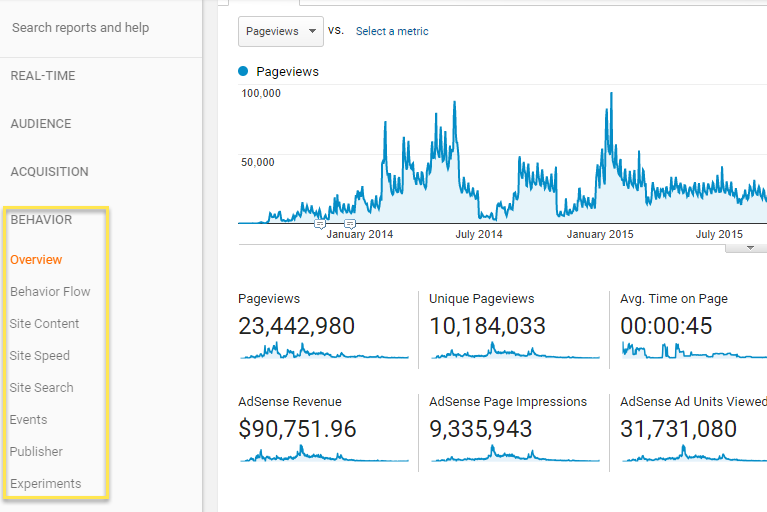
Do you want to know how people are engaging on your website? You'll be able to find these metrics on the Behavior Section of Google Analytics. Site content helps you identify the metrics on content pages on your website. Site speed shows the loading speed of your site and existing pages. The events tab is what I use to track clicks and other engagement metrics on my website. If I want to track video views on my website, I could setup event tracking and that would show here.

If you're a Google Adsense Publisher and you've connected your Analytics with Adsense, you'll be able to view Adsense metrics right inside Google Analytics. And lastly, you'll be able to run A/B split-testing campaigns using Google Optimize, and those results will be published in the experiments tab.
The Complete Guide To Google Analytics 16261788104749


Conversions section

For me personally, the most important section of Google Analytics is the conversion section. This is where you could actually put a dollar value and measure what's working for your business or not.

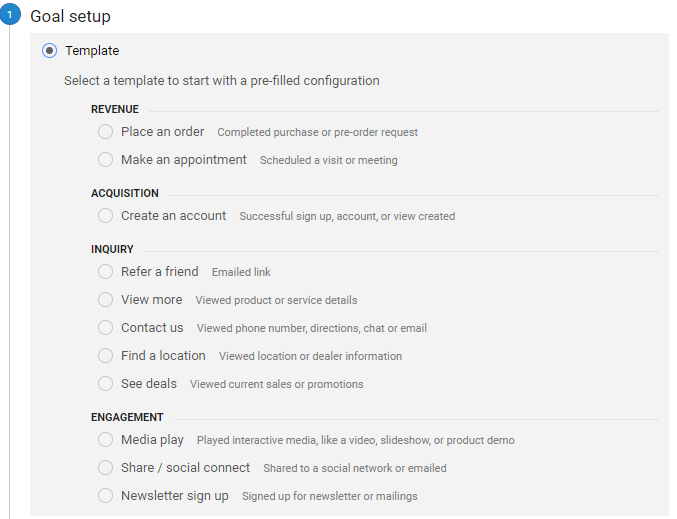
Before you can get conversions to work, you need to setup Goal tracking first. You can do that by clicking on the Gear icon on the left sidebar within Google Analytics and then under VIEW (choose the correct view) then click on Goals.
The Complete Guide To Google Analytics 16261788104750
You can then measure goals based on purpose. Is it to track orders? Setup a revenue goal. Do you want to measure how many signed up for an account on your website, setup an acquisition goal. Do you want to measure how many people actually watched your videos at least 50% of the time? Setup an engagement goal.

Ecommerce Tab — if you don't have an ecommerce website, you don't need to setup this section, but if you do have an ecommerce website, I strongly recommend that you set it up. You may also want to setup the enhanced ecommerce tracking to get more data out of your ecommerce stats.


Summing up

This was a huge post, but my goal here is not to overwhelm you but give you a complete overview of what Google Analytics can do to help you improve your website's stats and metrics.

One of the reasons I was able to grow traffic to my own websites is because of the constant keyword research and content that I publish on my websites. Part of this website keyword analysis is by looking at my competitor's keywords that are ranking for them.
To start measuring what's working and what's not working on your website visit my website and download my personal Google Analytics dashboards.

Speed up your search marketing growth with Serpstat!

Keyword and backlink opportunities, competitors' online strategy, daily rankings and SEO-related issues.

A pack of tools for reducing your time on SEO tasks.

Get free 7-day trial
The opinion of the guest post authors may not coincide with the opinion of the Serpstat editorial staff and specialists.

Rate the article on a five-point scale

The article has already been rated by 9 people on average 4.44 out of 5
Found an error? Select it and press Ctrl + Enter to tell us

Discover More SEO Tools

Keywords Grouping

Streamline your SEO efforts with our advanced clustering keywords tool

Search Google Trends

Unlock the power of your target audience's searched keywords with our keyword trends

Keyword Volume Checker

Bulk Keyword Volume Checker – get valuable information about your target keywords

Tools for Keywords

Keywords Research Tools – uncover untapped potential in your niche

Share this article with your friends

Are you sure?

Introducing Serpstat

Find out about the main features of the service in a convenient way for you!

Please send a request, and our specialist will offer you education options: a personal demonstration, a trial period, or materials for self-study and increasing expertise — everything for a comfortable start to work with Serpstat.

Name

Email

Phone

We are glad of your comment
I agree to Serpstat`s Privacy Policy.

Thank you, we have saved your new mailing settings.

Open support chat
mail pocket flipboard Messenger telegramm