Tutorial
Search engines storm
Using this tool, you can determine how many search engine results have changed over the last day.
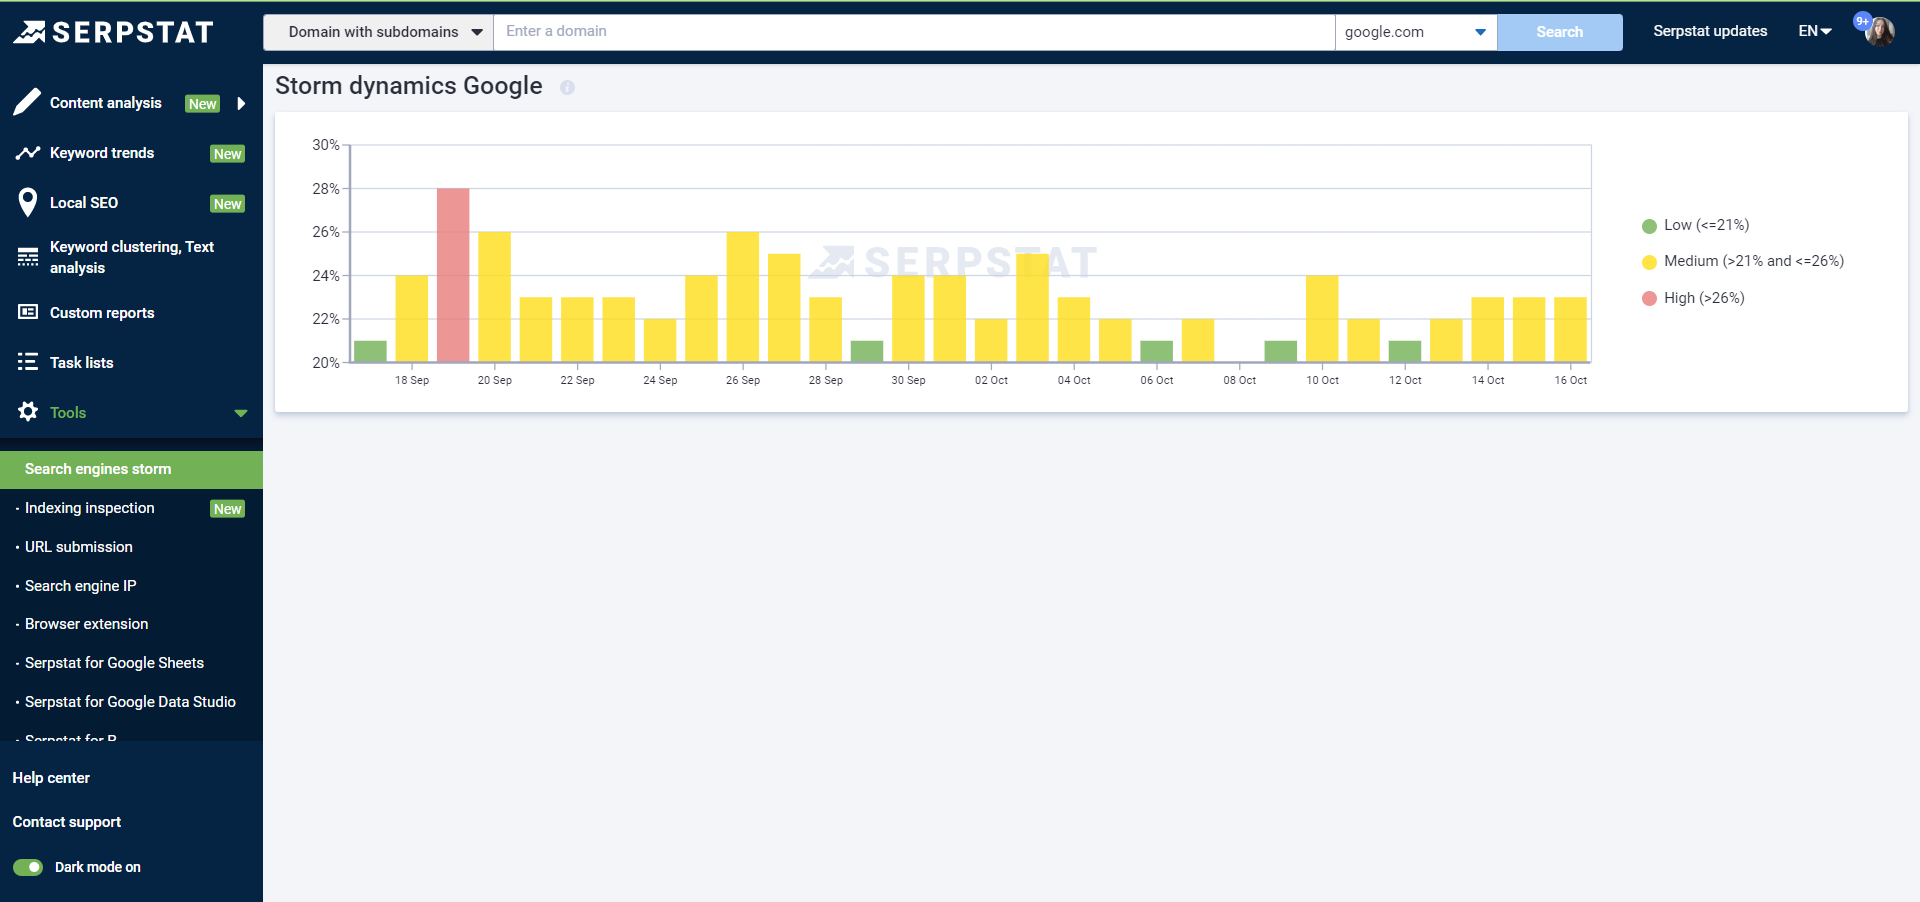
As part of the report, a graph is available with the storm dynamics for Google. The graphs contain the storm dynamics based on Serpstat for the last 30 days. The higher the storm rate, the more the search engine results have changed in the previous 24 hours.
One of three storm levels can be displayed within the charts, each of which will be marked with a corresponding colour:
- low storm level: less than 20%, indicated in green;
- average storm level: greater than or equal to 20%, but less than 25% is indicated in yellow;
- high storm level: greater than or equal to 25%, indicated in red.
Within the last 30 days, you can view the storm level for a specific day by hovering over the appropriate date. On hover, a tooltip with the date and storm level is displayed:
