13821 762 1
SEO 14 min read January 16, 2022

How To Perform A Niche Analysis Using Our SERP Crawling Tool

How To Make A Niche Analysis With Our Crawling Tool
Lead Product Manager at Serpstat
Alex Danilin
Lead Product Manager at Serpstat
Do you need to track the rankings of your website for hundreds of thousands of keywords? We do, in fact, have a solution. With our SERP Crawling tool, you can create your own Serpstat right on your own website! Are you interested in learning more?

Crawling Overview

SERP Crawling is a service that allows you to:

  • scan Google's top search results;
  • choose any region (or several);
  • select a convenient scanning schedule;
  • obtain data via the API.

Elements in search results that can be received via the SERP Position tool:

  • website position (according to the region and schedule you've set);
  • domain;
  • target URL;
  • title;
  • description;
  • the number of results;
  • paid search results on the phrase.

A report looks like this:
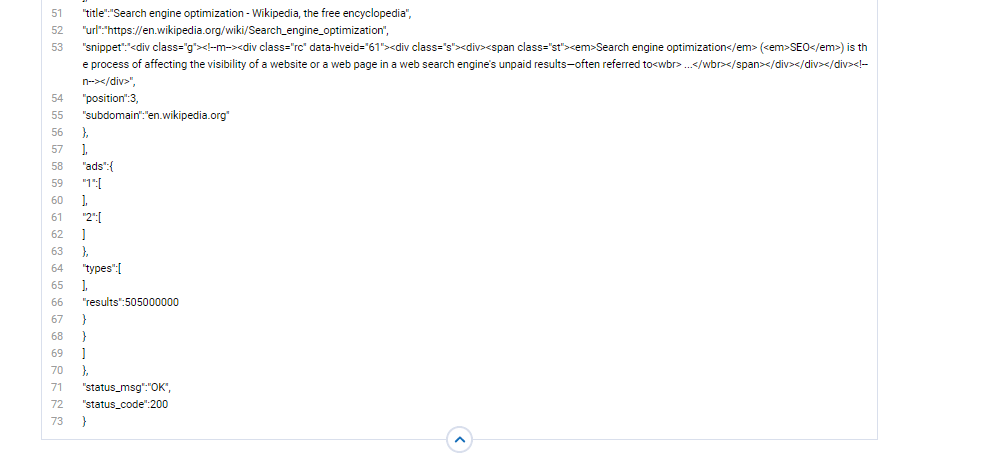
SERP parsing result
The process is carried out in the following way:
1
Visit our page and leave us a request.
2
We've prepared a special offer for you based on the amount of keywords you'd like to track: simply indicate the number of keywords you'd like to track and the databases you'd like to do so in. Note that we require a minimum of 500.000 keywords for this feature.
3
You can get data for any database in any language. Your queries should not contain search operators.
4
Data on top results are gathered with our unique API method that is not available with regular API access.
5
Results are available for 24 hours. After this period results are removed from our database.
6
Data will be provided in JSON format.
You can store data obtained by the parsing in a database (My SQL or Big Query, etc.) and make reports, graphs via Data Studio (optionally).

Crawling Features

1
Distribution of traffic share by market (one of the most popular cases):
in addition to positions, we can regularly scan volume on these phrases. Having the frequency and position of the phrase in your domain and competitor domains, it is already possible to predict the approximate traffic both in general and individual categories.
2
Tracking the dynamics of the site positions for the month:
you can find out which categories are in the lead, which fall behind and, accordingly, what are the keywords which make your website fall behind.
3
Identification of the leaders in the category:
which of the competitors came as close as possible to the positions of the promoted site and by what phrases.
4
Definition of phrases dropped from the top: both from the website being promoted and from the competitor's one.
5
Definition of phrases in the top:
sorting phrases/categories that have moved to the top. Based on these data, you can pay attention to these categories while promoting.
6
Tracking of regional search results:
you can track regional search volume for keywords to understand in which regions competitors are in the lead and on which topics. It often happens that you are the leader in large cities, but there are cities where niche competitors bypass you on specific topics, and you don't notice that.
7
Regular context monitoring will show when your competitor runs out of the budget, so you can calculate the most convenient days for placing, and who the competitors are and on which days the ads run.
8
Tracking snippet:
crawling will fix the snippets of each site, so you can evaluate the snippets of competitors, learn their weaknesses and improve yours.
9
The combination with Google Analytics and Serpstat in one report.
Would you like to learn how to use Serpstat to boost your results?
Leave a request, and our experts will advise you on the development of your project, share training materials, and offer test access to Serpstat!

How To Analyze A Niche

Let's say that you want to assess the site's niche in terms of SEO regularly. You'll want to keep an eye on what's happening at the top and adjust your promotion plan accordingly. Let's explore how on-page analysis tools, crawling, and Google Niche tools can assist you.

Data Storage And Extension

Serpstat API returns JSON objects during crawling, which can be simply transformed to a table display. The parsing results, for example, can be uploaded to BigQuery and subsequently evaluated there:
Parsing data
We lack CTR and keyword volume for a complete picture. You can calculate the traffic for each website from the top for each day if you combine this information. If you don't require such specifics, you can just get the total traffic.

Let's have a look at the example. We'd want to research the SEO niche in Google USA, and we've already received 64 requests in this regard. Every day, we analyzed tops, got volume from the Serpstat API, and, based on the position, found CTR statistics in Google search results. We won't go into the technical implementation of this solution because you can use whichever way you choose to process and store JSON objects. I used the R + Google Sheets + Google BigQuery combination, although Apps Script can be used instead of R.

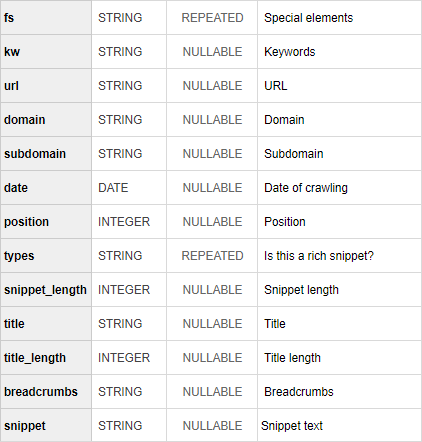
We'll add three columns to the final table with data — CTR, Queries (frequency) and Traffic. Then it's time to go to Data Studio and build interactive reports based on this table.

Analyzing Crawling Results

In Data Studio, you connect a data source, and in 15 minutes you collect a report on traffic and positions:
Put crawling results in Data studio
The average position by days is shown on the left graph, the average position by domain is shown on the right graph, and numerous useful numbers (average, lowest, maximum position) are shown separately in the upper section of the report. On the left graph, the sum of traffic each day, and on the right graph, the total amount of traffic on the domain are shown at the bottom.

We'll not pay attention to some obvious or non-obvious numbers, but let's see how we can work with such a report. Also, we will not distribute positions and traffic to different sheets of the report — this is how all of our data will be placed in one screen. I created the CTR for this report myself, any reference is coincidental :)

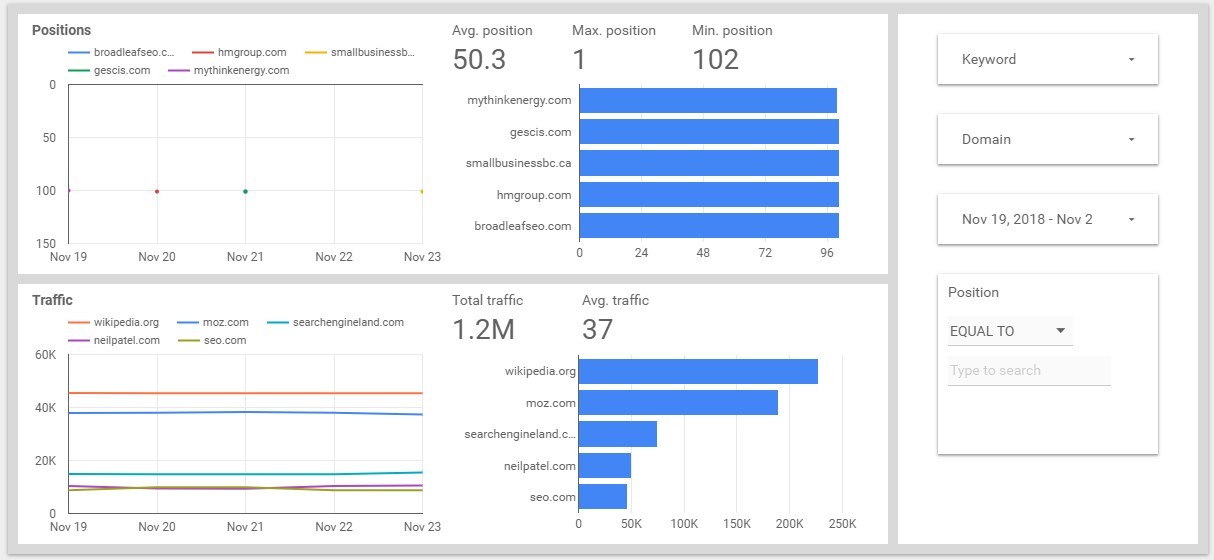
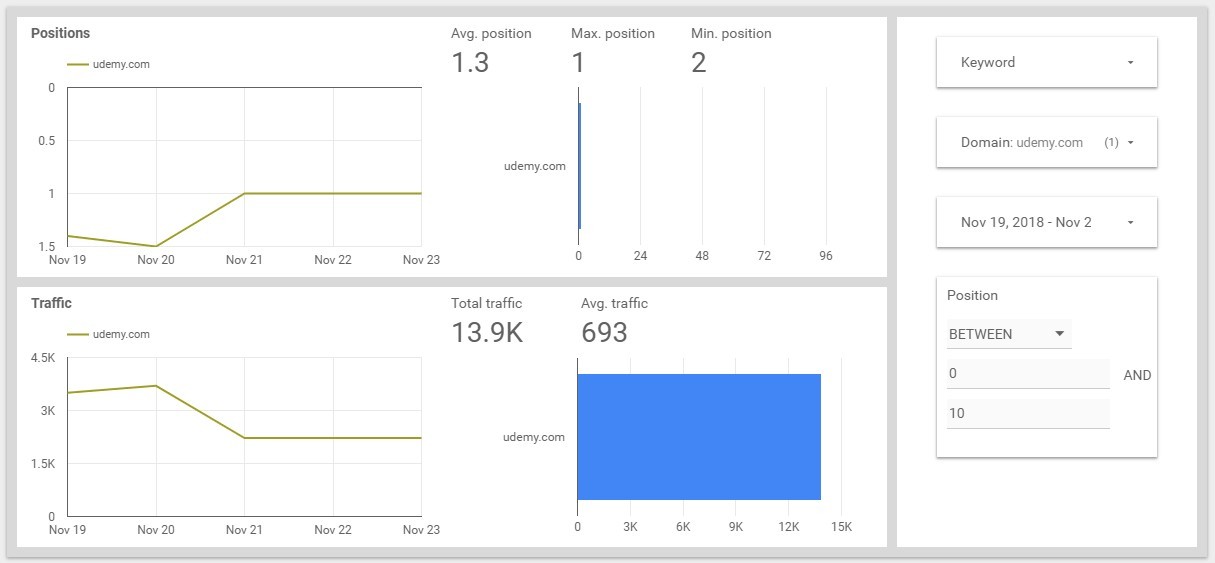
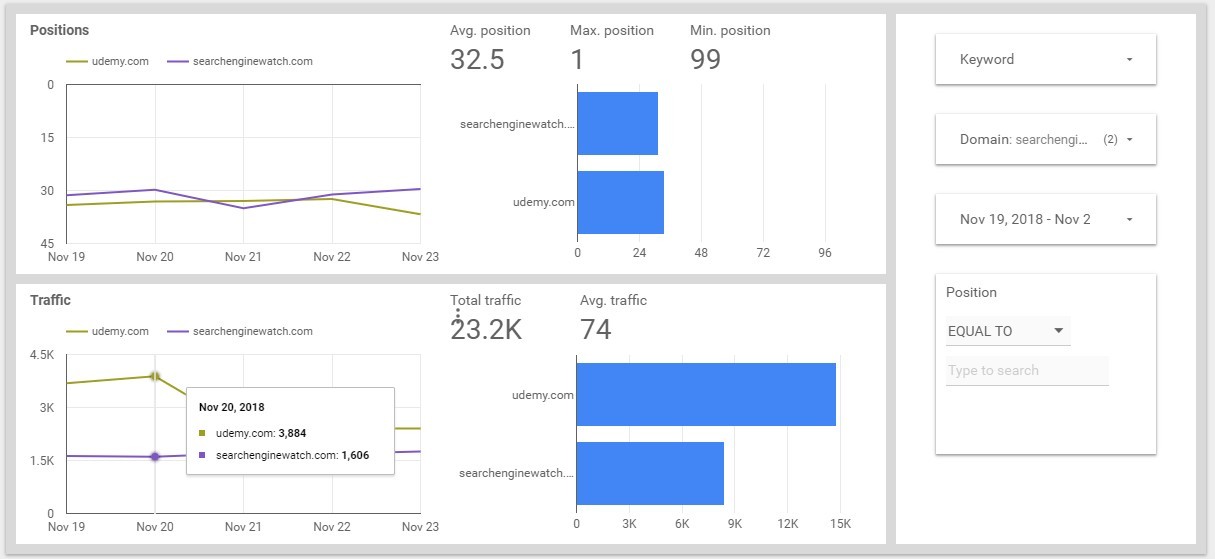
Dynamics Of Positions And Traffic Changes By Domain

We select the domain we require (let's say udemy.com — we'll deal with the SEO courses section) and examine how the average position and traffic vary over time. We may see variations in traffic in the example below with a relatively little change in the average position. The reason for the drop in traffic may be a traffic drawdown.
Data studio report

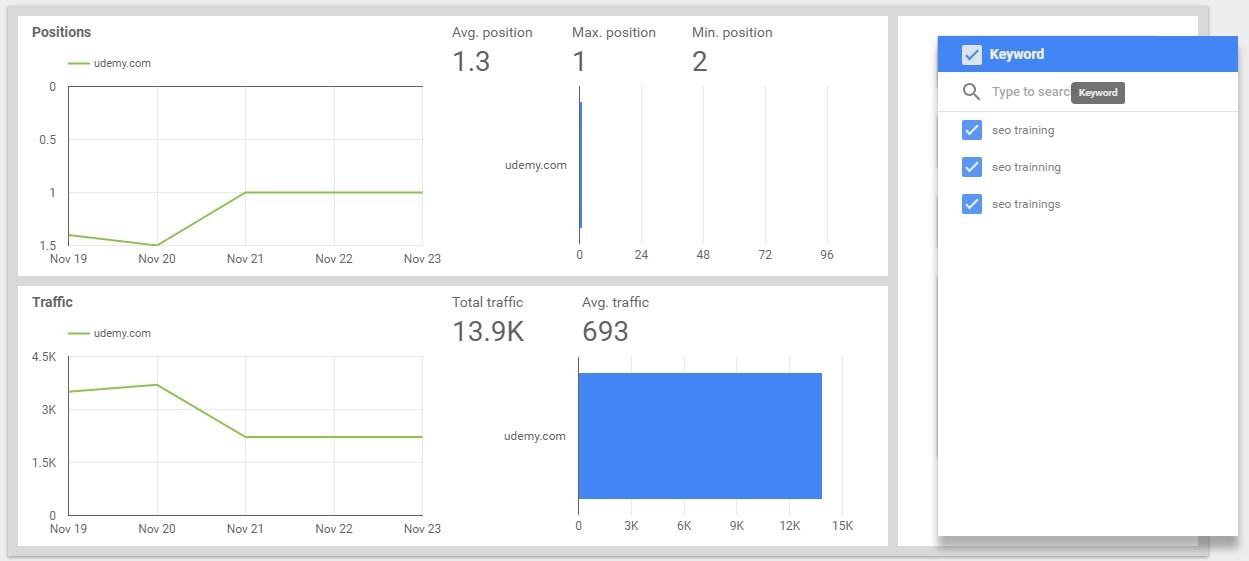
What Happens To Keywords In Certain Positions

Let's limit our report to data to top 10. Here we see the same — the average position has risen, and the traffic has fallen. This can be explained by the fact that the top 10 dropped out keywords that brought a fairly large amount of traffic.
Data studio report/ Positions
We also see that most of the traffic for udemy.com is brought by keywords from the top 10 and any changes in this range in the positions will greatly influence the traffic.

Analysis Of Changes In The Top By Keyword

In the phrase selection drop-down list, we may see all the phrases in a specific top. You can achieve this by creating a second table called Phrase — Date — Position. You may also start saving changes in positions across the domain in the data source for the report by creating tables with lists of phrases by domain for different dates to compare changes in the top.
Analysis of changes in the top by keyword
Let's take the keyword SEO trainings that brings traffic for Udemy and see what happens there:
Check positions in data studio
The Positions report was not informative, but looking at the Traffic we can see that Udemy is the winner of all and the main competitor is Search Engine Watch. Let's compare these two domains.
Positions in Data studio
Here, the situation is strange: with a decrease in the average position, the traffic of Udemy has risen, while in Search Engine Watch these indicators behave the same way. This can be explained by the principle of report building. Udemy began to appear in other positions as well, and the average position fell. In this case, I count traffic simply as the sum of traffic for all positions, that's why it has grown.

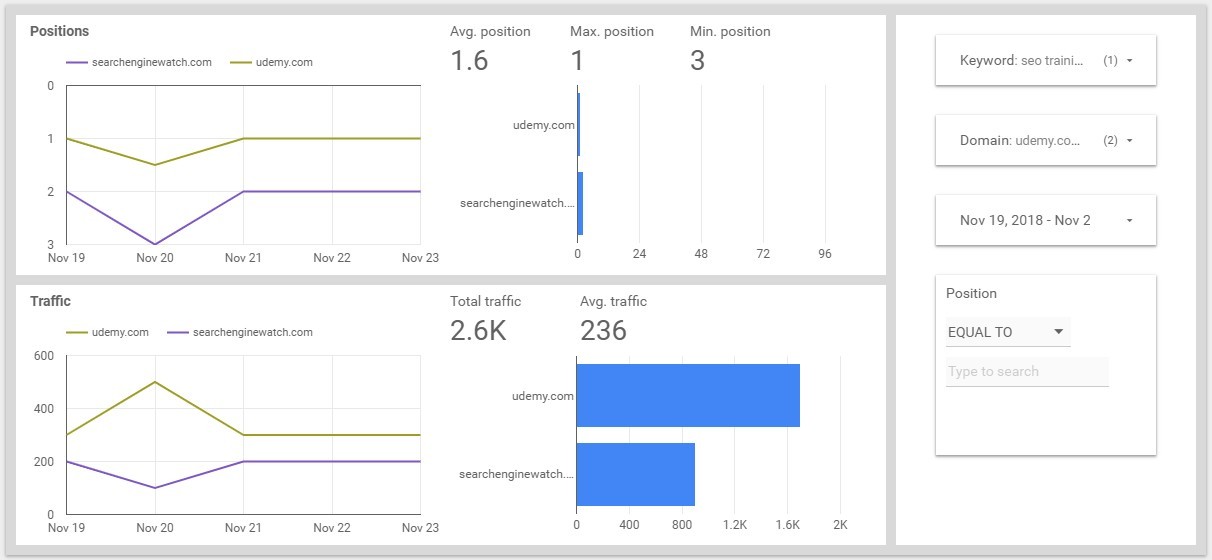
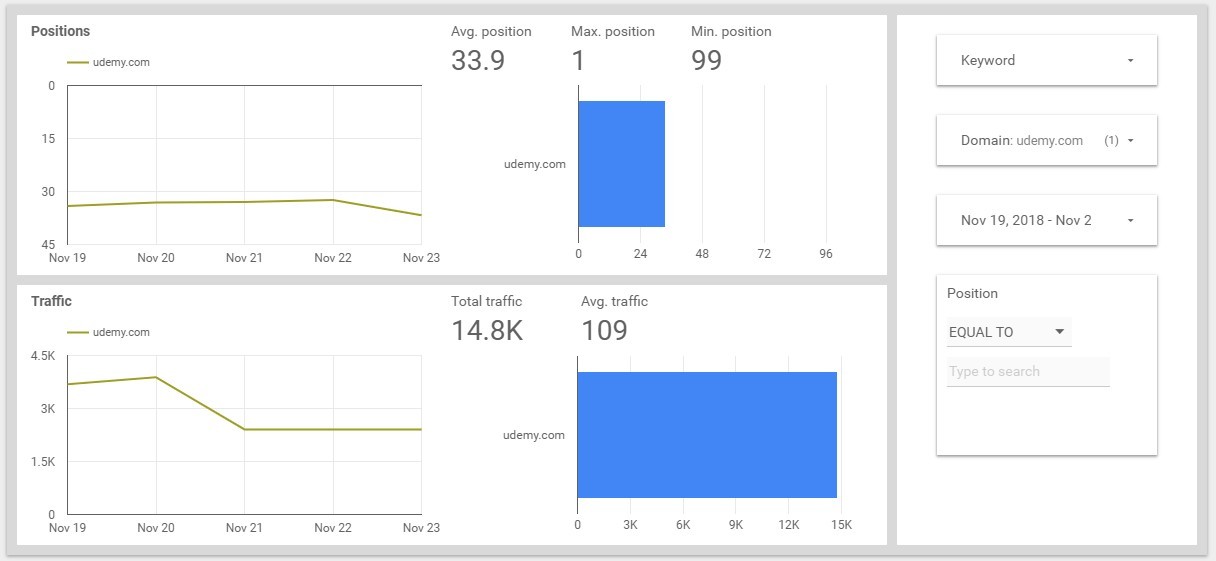
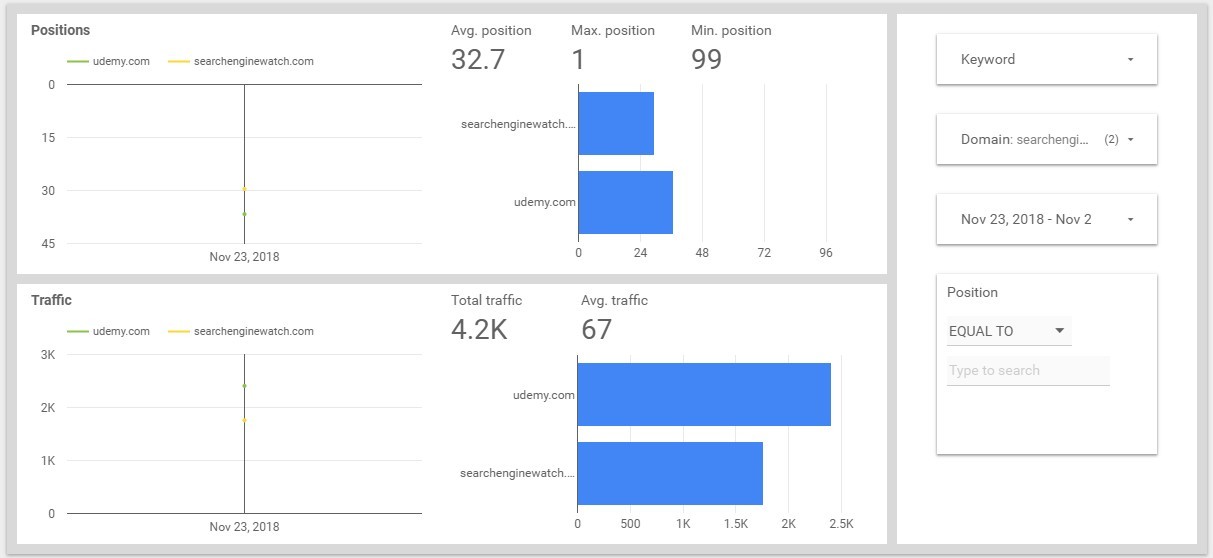
Comparison With Competitors

Let's compare Udemy and Search Engine Watch for all requests. We see that with a close average position, the traffic of the sites is very different.
Comparison with competitors
For example, you can look at the traffic for each day right on the graph:
Comparison in data studio
For each of the sites, you can see the proportion of traffic in the niche. To do this, you can create a separate report if you need to check this index regularly. We'll do a simple calculation.

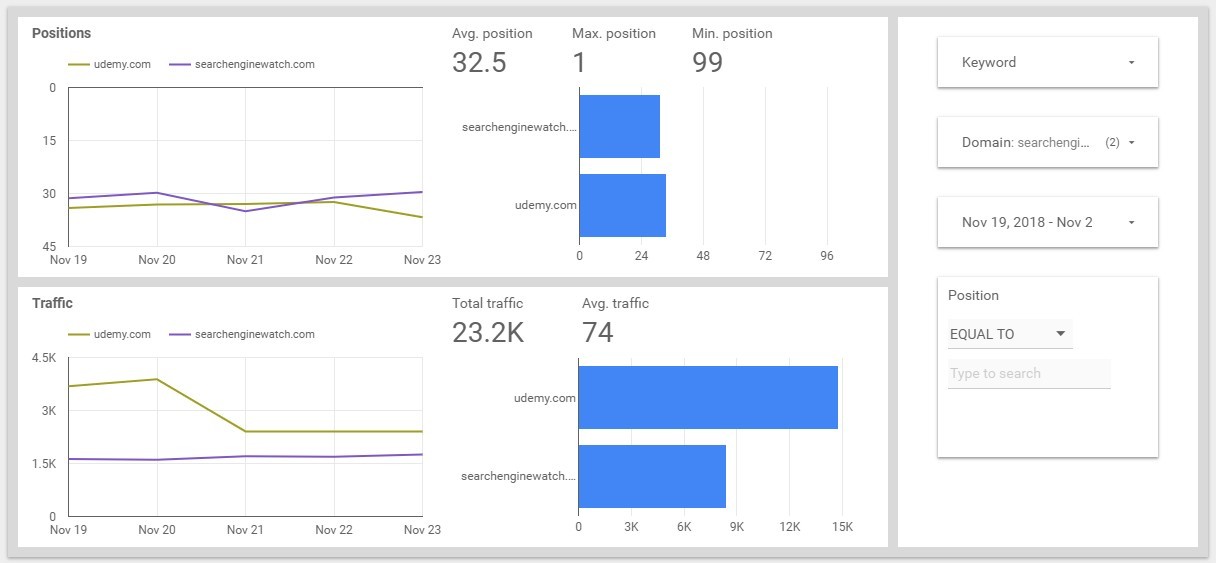
We take the data for November 23. The total traffic is 237.3 thousand. The traffic on Udemy is 2.4 thousand, this is about 1%. At Search Engine Watch traffic is 1.7 thousand, this is 0.7%
Search Engine Watch Traffic

What We Can Do With The Crawling Results

In our case, we only received data for one region. You can compare the domain in different regions or track changes in request results based on the region if you parse the tops in multiple locations.

We also left out special element analysis and contextual advertising. With this information, you may make CTR corrections based on their availability, allowing you to generate more accurate traffic estimations.

Another possibility is parsing snippets. You can analyze snippets of sites in the top 10 and take additional information from there for optimizing pages. For example, all your competitors offer free shipping directly in the snippet, but you don't, and because of that you lose competitive advantage.

You can add all this information to a report in Data Studio, and it'll turn into a comprehensive top analytics system. Such a thing is always convenient to keep on hand. Start by collecting data and further improve it as needed.

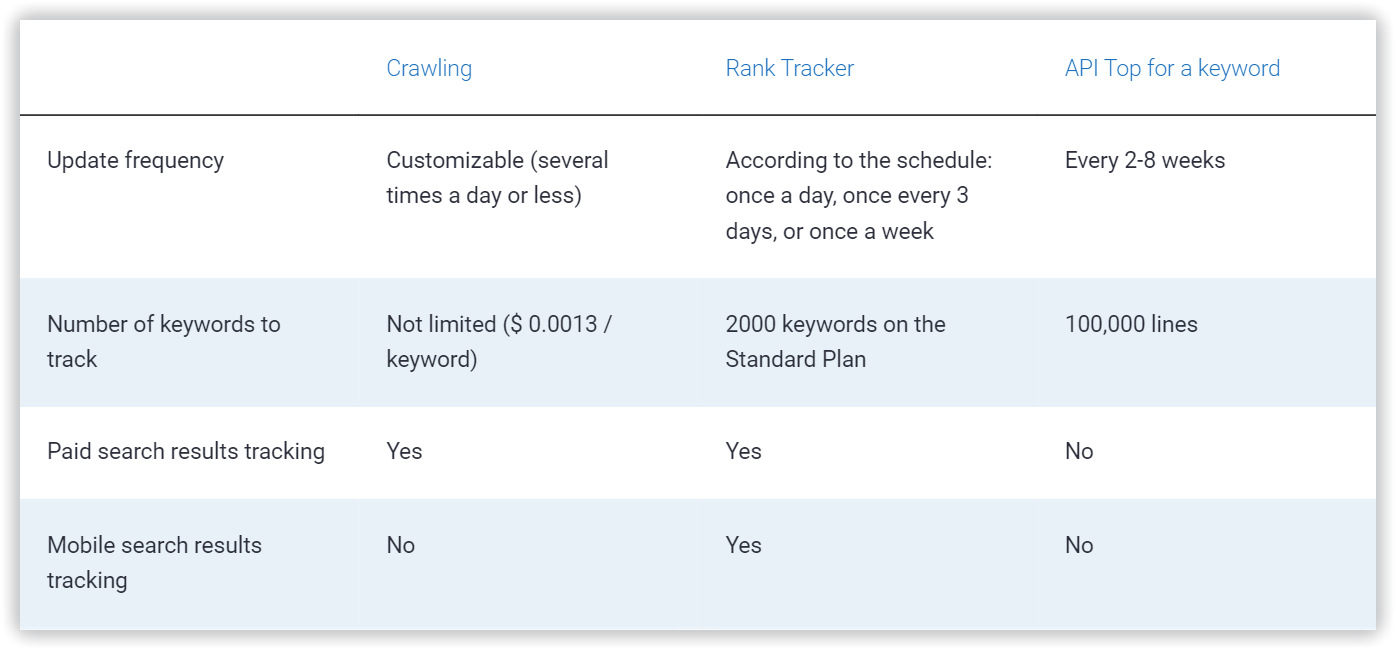
Difference Between Crawling, Rank Tracking And The "Top For A Keyword" API

Here we collected the key differences between our popular tools: Сrawling, Rank Tracker, and Top by a keyword API:
Comparison of Serpstat tools

FAQ

What is SERP crawling?

SERP crawling is a process of collecting data of the search engine results page.

Why you should try Serpstat SERP crawling?

Serpstat SERP crawling allows you to collect big data and build a regularly updated analytics for clients in their personal accounts on your website.

Summing Up

1
By working with Crawling, you can build a little Serpstat inside your site. You don't need to go to Serpstat to upload any data, you can build your own tool, based on the data we give, in any form.
2
You can build a regularly updated analytics for clients in their personal accounts on your website. That is, the clients enter their account on the website of their SEO agency, and there are millions of graphs on their project.
3
Serpstat Crawling is used by well-known marketplaces, aggregators, and large in-house teams. And you can easily follow their example :)
To keep up with all the news from the Serpstat blog, subscribe to our newsletter. Also, follows us on LinkedIn, Facebook, and Twitter ;)

Speed up your search marketing growth with Serpstat!

Keyword and backlink opportunities, competitors' online strategy, daily rankings and SEO-related issues.

A pack of tools for reducing your time on SEO tasks.

Get free 7-day trial

Rate the article on a five-point scale

The article has already been rated by 12 people on average 4.33 out of 5
Found an error? Select it and press Ctrl + Enter to tell us

Discover More SEO Tools

Backlink Cheсker

Backlinks checking for any site. Increase the power of your backlink profile

API for SEO

Search big data and get results using SEO API

Competitor Website Analytics

Complete analysis of competitors' websites for SEO and PPC

Keyword Rank Checker

Google Keyword Rankings Checker - gain valuable insights into your website's search engine rankings

Share this article with your friends

Are you sure?

Introducing Serpstat

Find out about the main features of the service in a convenient way for you!

Please send a request, and our specialist will offer you education options: a personal demonstration, a trial period, or materials for self-study and increasing expertise — everything for a comfortable start to work with Serpstat.

Name

Email

Phone

We are glad of your comment
I agree to Serpstat`s Privacy Policy.

Thank you, we have saved your new mailing settings.

Report a bug

Cancel
Open support chat
mail pocket flipboard Messenger telegramm